Chapter 3 Methods and Data
- Note:
- Some material in this chapter is adapted from M. C. Frank et al. (2016).
We begin by introducing the structure of our dataset and the database that contains it. In the second section, we give some descriptive information on the datasets included in the database.
3.1 Database
Why use a database to store vocabulary data? Consider the standard format of raw CDI data, illustrated in Figure 3.1 for a small slice of the original CDI norming data (Fenson et al. 1994, 2007).
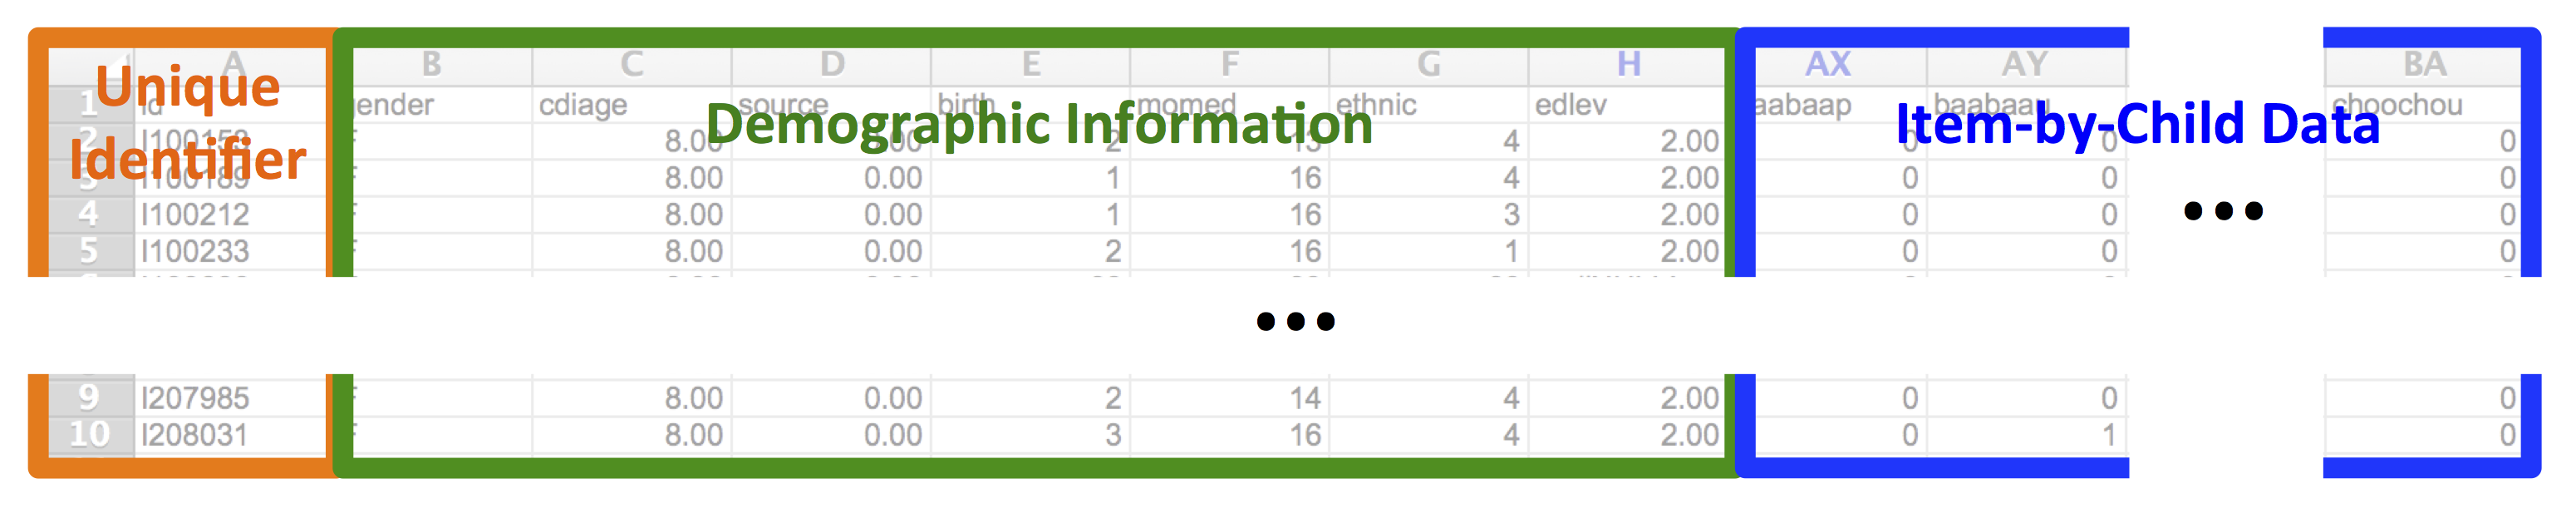
Figure 3.1: Example data from the CDI norming sample (Fenson et al., 2007). Each row has a unique child identifier, demographics, and word-by-word checklist data.
Each row is a child, each column gives a variable – either a demographic variable or the response of the parent on a particular item. Although this format is useful for homogeneous administrations of a single instrument, it cannot accommodate multiple instruments, multiple languages, or datasets with different sources or kinds of demographic information. Consolidating data across different instruments is very difficult, and tracking data on children with multiple longitudinal administrations of a single instrument must also be done in an ad-hoc manner. The move to a database format allows far more flexible and programmatic handling of heterogeneous data structures from different sources.
Further, as information about particular entities becomes available – for example, cross-linguistic mappings of lexical items – this information can be added in a way that preserves previous analyses. In a tabular format, such functionality is not guaranteed, and changes to the structure of the dataset will necessarily break code for previous analyses. A database, especially when supplemented with an appropriate application programming interface (API, see below), can solve this problem elegantly.
3.1.1 Database architecture
A relational database such as Wordbank is at its heart an ontology: a set of entities that are described in a series of tables linked by unique identifiers. The primary entities in the Wordbank database are:
- Instrument: A specific parent-report survey or questionnaire with a particular set of items. For example, the American English Words & Sentences form is an individual instrument.
- Item: A particular question on an instrument. A specific word like dog is our canonical CDI item, but other items include questions about gestures, morphological and syntactic complexity, and other aspects of early language or behavior.
- Administration: A particular instance of an instrument being given to a child, with an associated child age and source (the contributing lab).
- Child: A unique individual, with associated demographics.
- Language: A particular language or language community for which a CDI instrument has been adapted. Note that this definition of language distinguishes e.g. American and British English; in the text of the book we use the phrase “language or dialect,” but this label is too clunky for a variable name.
These entities are related by two primary groups of tables in Wordbank. The common tables store data that is shared between CDI instruments, including information about administrations (individual instances of a form being filled out for a child), and items (words and other questions on a form). Then the instrument tables store the item-by-item response data for particular CDI instruments. We currently include all items on CDI instruments, including questions about communication, gesture, morphology, and grammar (though in quite a few of the datasets that we archive these non-vocabulary questions have not been digitized so data on these are sparse at present; see e.g., Chapters 7 and 13).
Wordbank is designed so that it can accommodate data from a wide variety of instruments, both within and across languages. Indeed, at the time of rendering, the site includes data from 82055 administrations of the CDI across 29 different languages or dialects and 56 different instruments (much though not all of this larger number comes from having available both younger- and older-child focused forms in each language/dialect).
3.1.2 Implementation
Wordbank is constructed using free, open-source tools. The database is a standard MySQL database, managed using Python and Django. All code for Wordbank is hosted in GitHub repositories, with the primary site repository containing data and database code,
the R package repository containing code for the API, and the book repository containing the code and text for this manuscript.
All data uploaded to Wordbank are open and freely available for download, both through the site itself and through the GitHub repository. The site includes only de-identified data that cannot be linked to individual parents and children under US Department of Health and Human Services’ “Safe Harbor” standard. Because of these features, the Stanford Institutional Review Board determined that the Wordbank project does not constitute regulated human subjects research.
3.1.3 The web interface
Our website, http://wordbank.stanford.edu provides a set of interactive visualizations so that interested readers can explore the data in the database. A tutorial introduction to these visualization apps is given in M. C. Frank et al. (2016). We developed these apps to allow quick access to basic generalizations about the distribution of vocabulary totals (similar to analyses in Chapters 5 and 6) and to information about individual items (similar to Chapter 8).
3.1.4 The wordbankr API
An application programming interface (API) is a set of abstractions that allow applications to interact with a resource (e.g., a set of data like Wordbank) through consistent abstractions. Although in principle it is possible to construct raw SQL queries to Wordbank, in practice all access is through an R API that constructs individual SQL calls. This API is distributed to R users through the wordbankr package, which is available through CRAN.
We developed this package, wordbankr, to provide a simple and flexible API for the Wordbank dataset (M. C. Frank et al. 2016), and our current book depends on it heavily. The package provides a consistent set of function calls for retrieving data from the underlying database, for example get_instruments and get_administrations to retrieve all or subsections of these tables, respectively. We do not describe the package in depth here, since it is described in our previous paper and in its online documentation.
3.1.5 Unilemmas: cross-linguistic conceptual mappings
As described in Chapter 2, it is sometimes useful to (cautiously) compare the developmental trajectory for a single concept across multiple languages. To facilitate these comparisons, we created “unilemmas,” cross-linguistic mappings from lexical items to single (English) forms that stand for a particular conceptual abstraction. Some lexical items are represented on only one or a handful of instruments, but there are many that are common across a large number of instruments, leading to an opportunity for cross-linguistic comparison.
Unilemmas were created for particular instruments by following a two-step procedure. First, using a pool of English unilemmas, we proposed candidate mappings for each lexical item on a form. This first step was often accomplished by a non-native speaker using translation resources and the context of the form (e.g., that an item occurs in the “animal sounds” section). Second, we recruited a linguistically-sophisticated native speaker of the language (often though not always a psychologist or linguist), provided them with the candidate unilemma list, and asked them to review this list item by item and suggest corrections and amendments.8
Not every instrument has unilemma mappings, but they are currently available, at least partially, for 46 out of the 56 instruments.
3.1.6 A note on age
Developmental psychologists are very fond of using temporal units like months and years as rough guides. Children tend to begin to crawl between 5 and 8 months, and say their first word around one year. This practice is fine for rules of thumb, but we also use these units for measurement as though they were precise (e.g., “infants with ages between 7;0 and 8;0”) when in fact such infants will vary in the number of days since their birth depending on facts like whether their seven months of life encompassed February or not. A similar problem is true of years as a scientific unit – because of leap years, years technically include 365.2524 days – though the magnitude of the imprecision is smaller.
Despite these issues, months are the currency of language development research, and we often receive contributed datasets with months as the only measure of age. In Wordbank, we define a standardized month as 365.2524 / 12 = 30.4377 days. When possible, we compute the number of days from birth to testing and then compute the number of standardized months that the child has lived. If this is not possible, we use months as reported in the dataset. We define an eight-month-old (age == 8) as a child who has lived between 8 and 9 standard months: their age is in the range [8–9) standard months. (The alternative definition, from 7;16–8;15, is sometimes used in infancy research but is in our opinion less intuitive.)
3.2 Datasets
This section gives a broad overview of the data we have available. Unlike projects in which data are collected by the organizers, in our work here, we rely on the kindness of others in contributing data that are often years or decades old. Some datasets come via an email containing well-curated tabular data; others were contributed in more idiosyncratic formats or even on paper. One dataset was even retrieved by one of us from a doorstep several hours drive away, in the form of a paper bag full of paper forms. Thus, the amount and type of meta-data available for some datasets is limited. For example, we have limited demographic information for some datasets and only vocabulary – not complexity or gesture – items for others. In many cases we do not have full details of instructions and administration for a particular dataset. This section gives an overview of data availability and some demographic comparisons of the samples. Specifics of each dataset – to the extent that they are available – are given in Appendix A.
3.2.1 Data provenance
As mentioned above, datasets come from a variety of sources. In all cases, the preferred citation for each dataset and its contributor is given on the Wordbank contributors page. Several of these datasets were transferred second-hand from a pre-existing database (CLEX-CDI; Jørgensen et al. 2010), while many of the others were contributed directly via electronic or paper forms. In the case of paper forms, we re-keyed the forms using double-entry methods (either ourselves or via a commercial contractor).9
Each of these datasets is then imported to the database by creating a custom import key that matches individual columns of the dataset to particular database fields (e.g., item types like words or gestures, or standardized demographic fields). These mappings are preserved along with the raw data so that they can be re-checked later.
3.2.2 Overview of the data
Wordbank currently contains data from 29 language communities. Many of these are from instruments similar to the original Words & Gestures (WG, “infant”) / Words & Sentences (WS, “toddler”) format, with around 400 items in WG and 700 in the WS. Typically, WG forms are intended for children from 8–18 months and WS forms are intended for children 16–30 months, but these ranges are flexible. Some WS forms are used up to 36 months or extended as low as 12 months (in cases where a single form is considered desirable by the researchers constructing the adaptation).
Wordbank also includes some other forms that do not fit into this schema. Some of these are “short forms” with no internal category structure and fewer items overall, and these are excluded from many item and category analyses. But others have many structural features of WS and WG forms. For example, the Oxford CDI is a WG-style form with comprehension as well as production estimates, but applied to a larger age range. We group this form with WG forms because it measures comprehension. The Mandarin Infant Checklist (IC) and Toddler Checklist (TC) are checklist forms without grammatical and gesture items but with structured sets of vocabulary items. We include these checklist forms in analyses where WS and WG data are included, grouping them by their target age range.
Table ?? shows an overview of the instruments in Wordbank. The number of administrations available is highly variable across instruments and languages. Figure ?? shows the distribution of administrations across forms and languages. We have fewer WG administrations than WS forms for essentially all languages/dialects. These instruments have global reach, although the maximal number cover North America and Western Europe. African, South American, and South/South-East Asian languages are notably under-/un-represented. Figure ?? indicates which countries have their population represented in the dataset.
3.2.3 Administration details
Data in the dataset were gathered between the beginning of the first CDI norming study in 1990 and the present, with the majority of datasets gathered within the 10–15 years prior to the writing of this book. The details of administration vary widely from dataset to dataset. Though we have different levels of knowledge regarding the exact details of administration, we know that the three most common circumstances of administration (in no particular order) are:
- On paper in a lab or other space, with instructions given in person by a researcher (e.g., Fenson et al. 1994);
- On paper, with the form sent by mail with written or telephone instructions from a researcher (e.g., the British English Twins Early Development data, which were sent home as part of a packet; Dale et al. 2003); or
- Electronically, with instructions given either electronically or by phone (e.g., Kristoffersen et al. 2013).
We have limited direct evidence about the effects of particular administration details on the overall results, although some early studies found comparable results across mail-in and personal administration (Jackson-Maldonado et al. 1993). Such evidence would require random assignment of parents to administration method rather than, e.g., a comparison of administration methods across different populations in which there are obvious sample-related confounds. Nevertheless, the CDI community has amassed a substantial set of anecdotal experiences. For example, improper administration or limited instructions can result in over- or under-reporting, especially with respect to comprehension (see e.g., Feldman et al. 2000).
In one trial we conducted using electronic administration, we found that basic written instructions were misinterpreted by some proportion of parents (as evinced by an atypical number of floor and ceiling responses). This proportion appeared to decrease when we made an attempt to simplify and illustrate the instructions that we gave. Such experiences suggest – congruent with the general warnings above – that caution is warranted in interpreting absolute comparisons between different populations where there are also differences in administration style. We return to questions about administration in our final chapter, Chapter 18.
3.2.4 Demographic details
In addition to differences in administration and form, samples from different studies also differ in myriad other ways. The most important of these, especially cultural differences between language communities, are extremely hard to quantify. But we can make a first stab at investigating some similarities and differences between the convenience samples from different studies by comparing demographics where they are available. The demographic makeup of our datasets is shown in Figure 3.2 for sex, Figure 3.3 for maternal education, and Figure 3.4 for birth order.
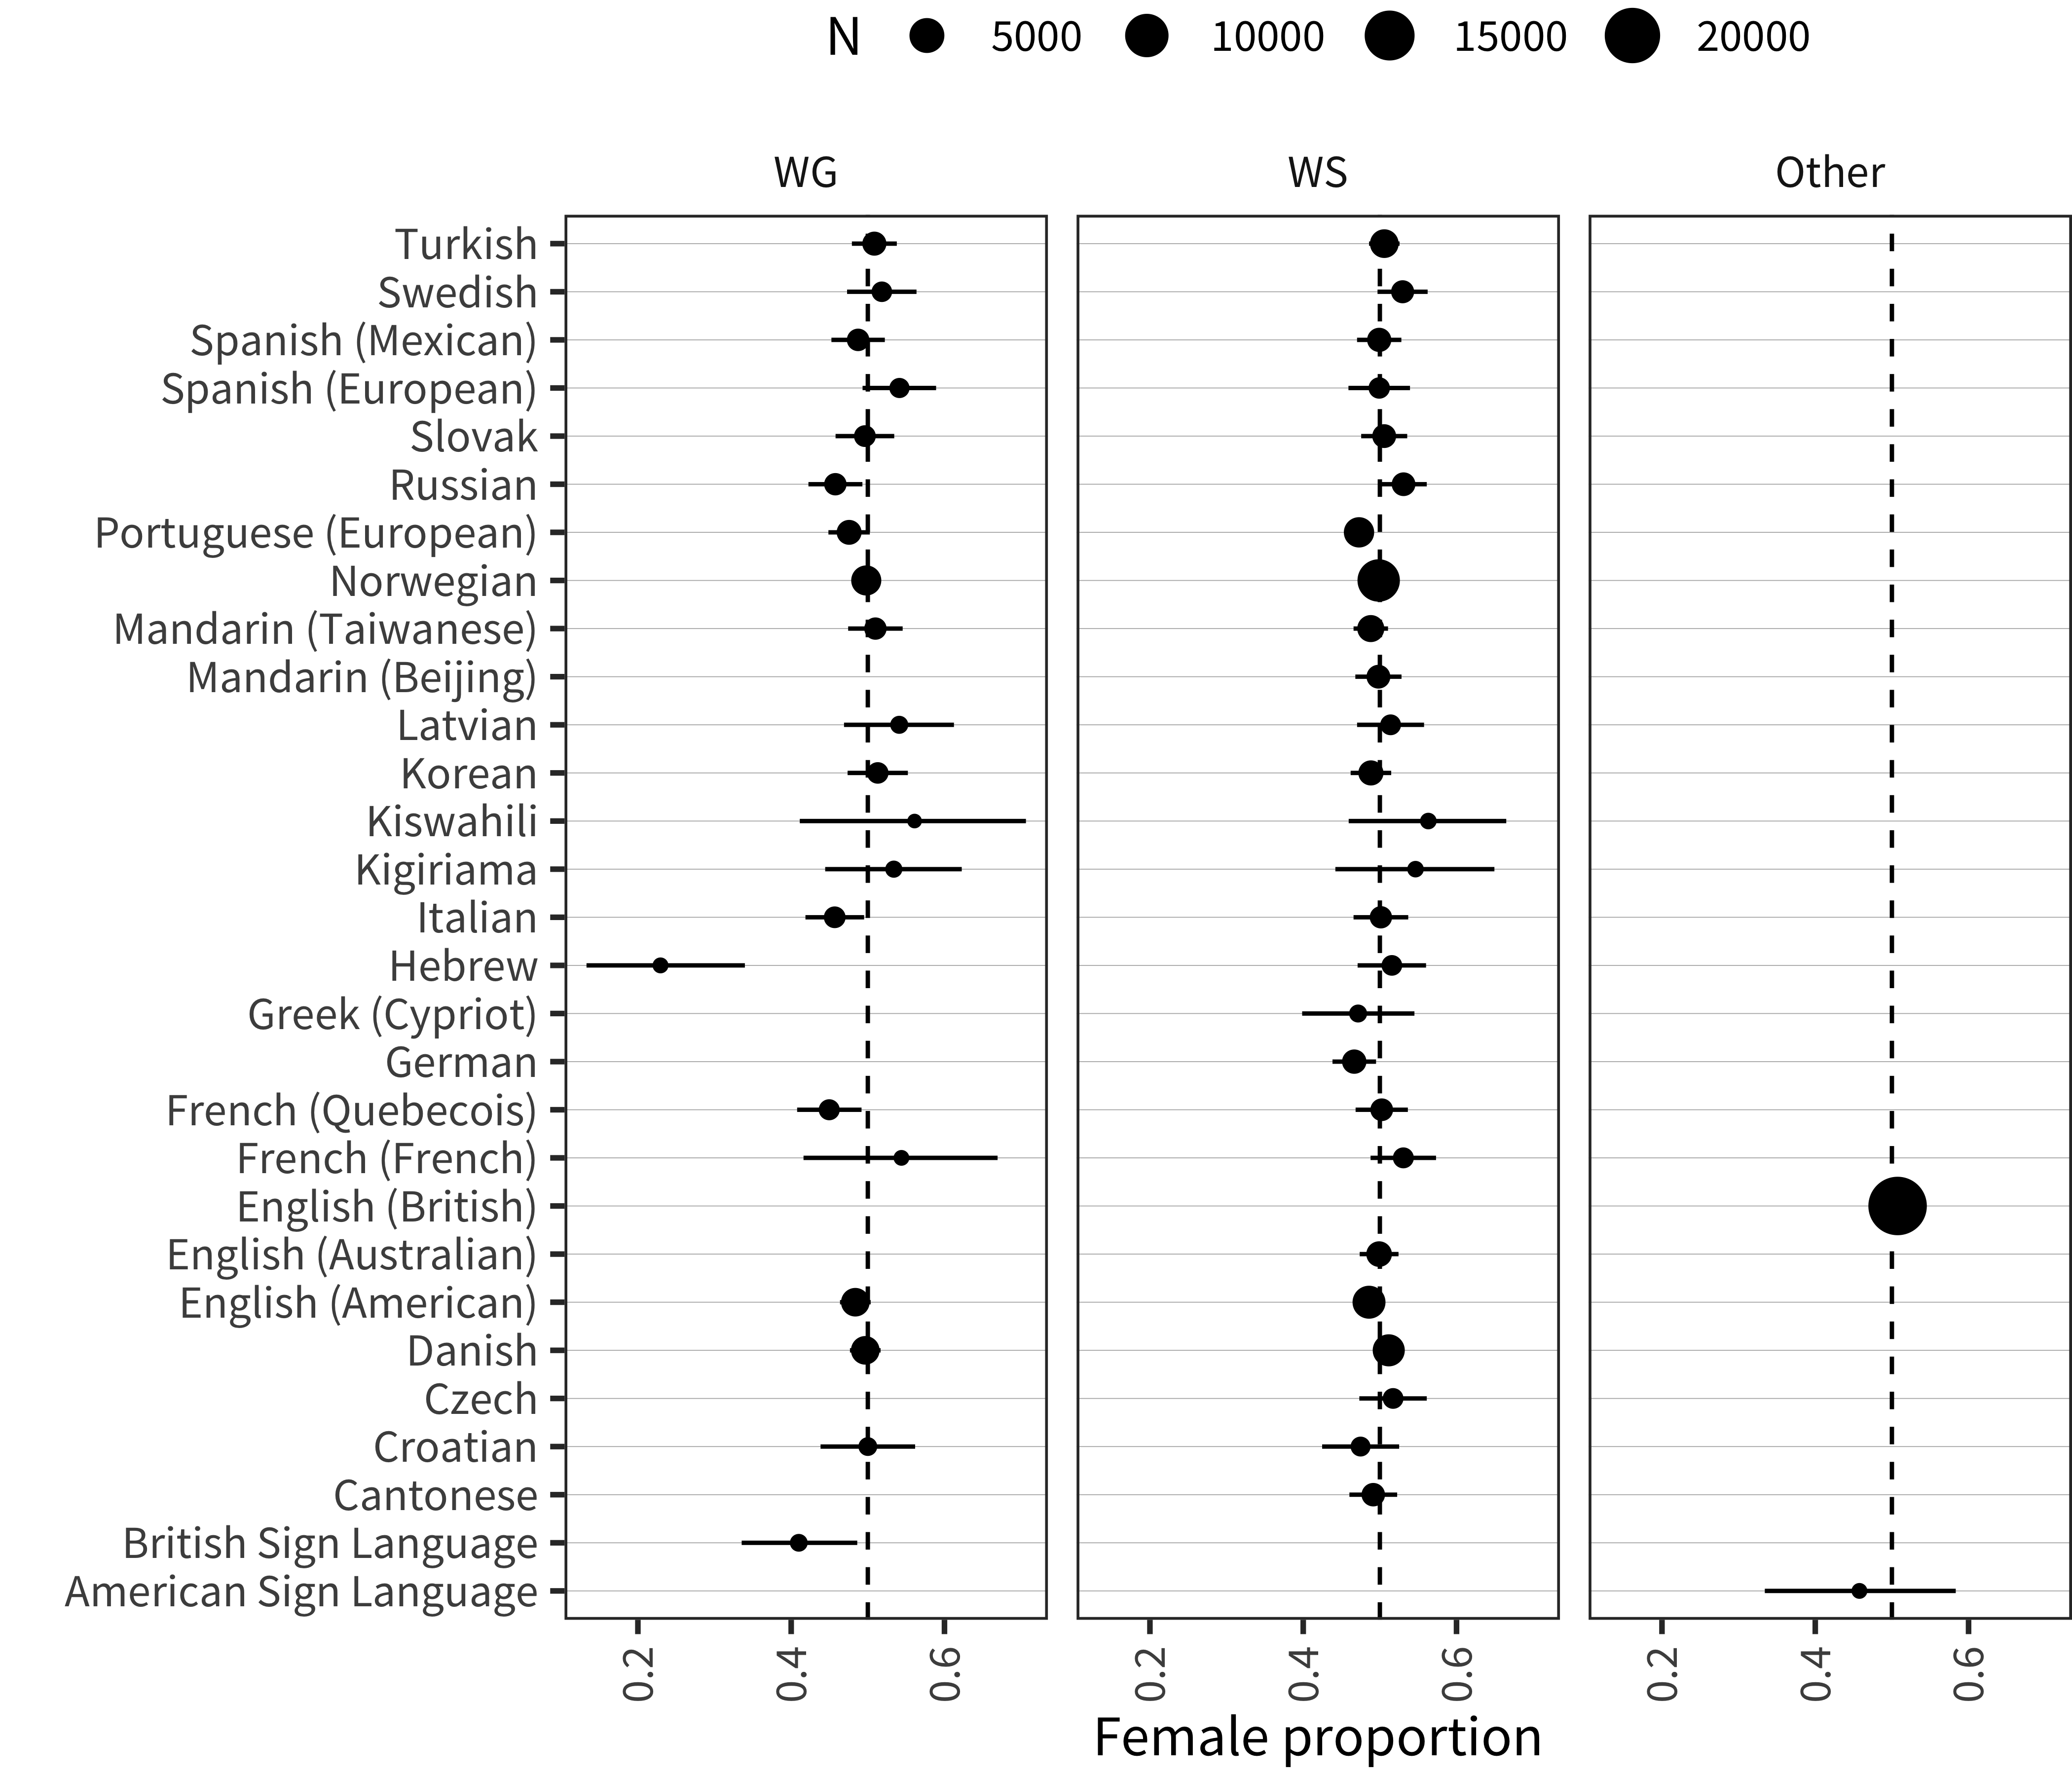
Figure 3.2: Proportion of female-assigned children for each instrument.
Sex proportions tend to be quite close to .5, with a few exceptions for small datasets. Several WG datasets (e.g., British Sign Language, Russian, Italian, Quebec French) have more males than might be expected by chance. This pattern is important because (as we will investigate in Chapter 6), there are systematic differences in vocabulary size between boys and girls, and so sample differences in gender will lead to absolute differences in mean vocabulary size.
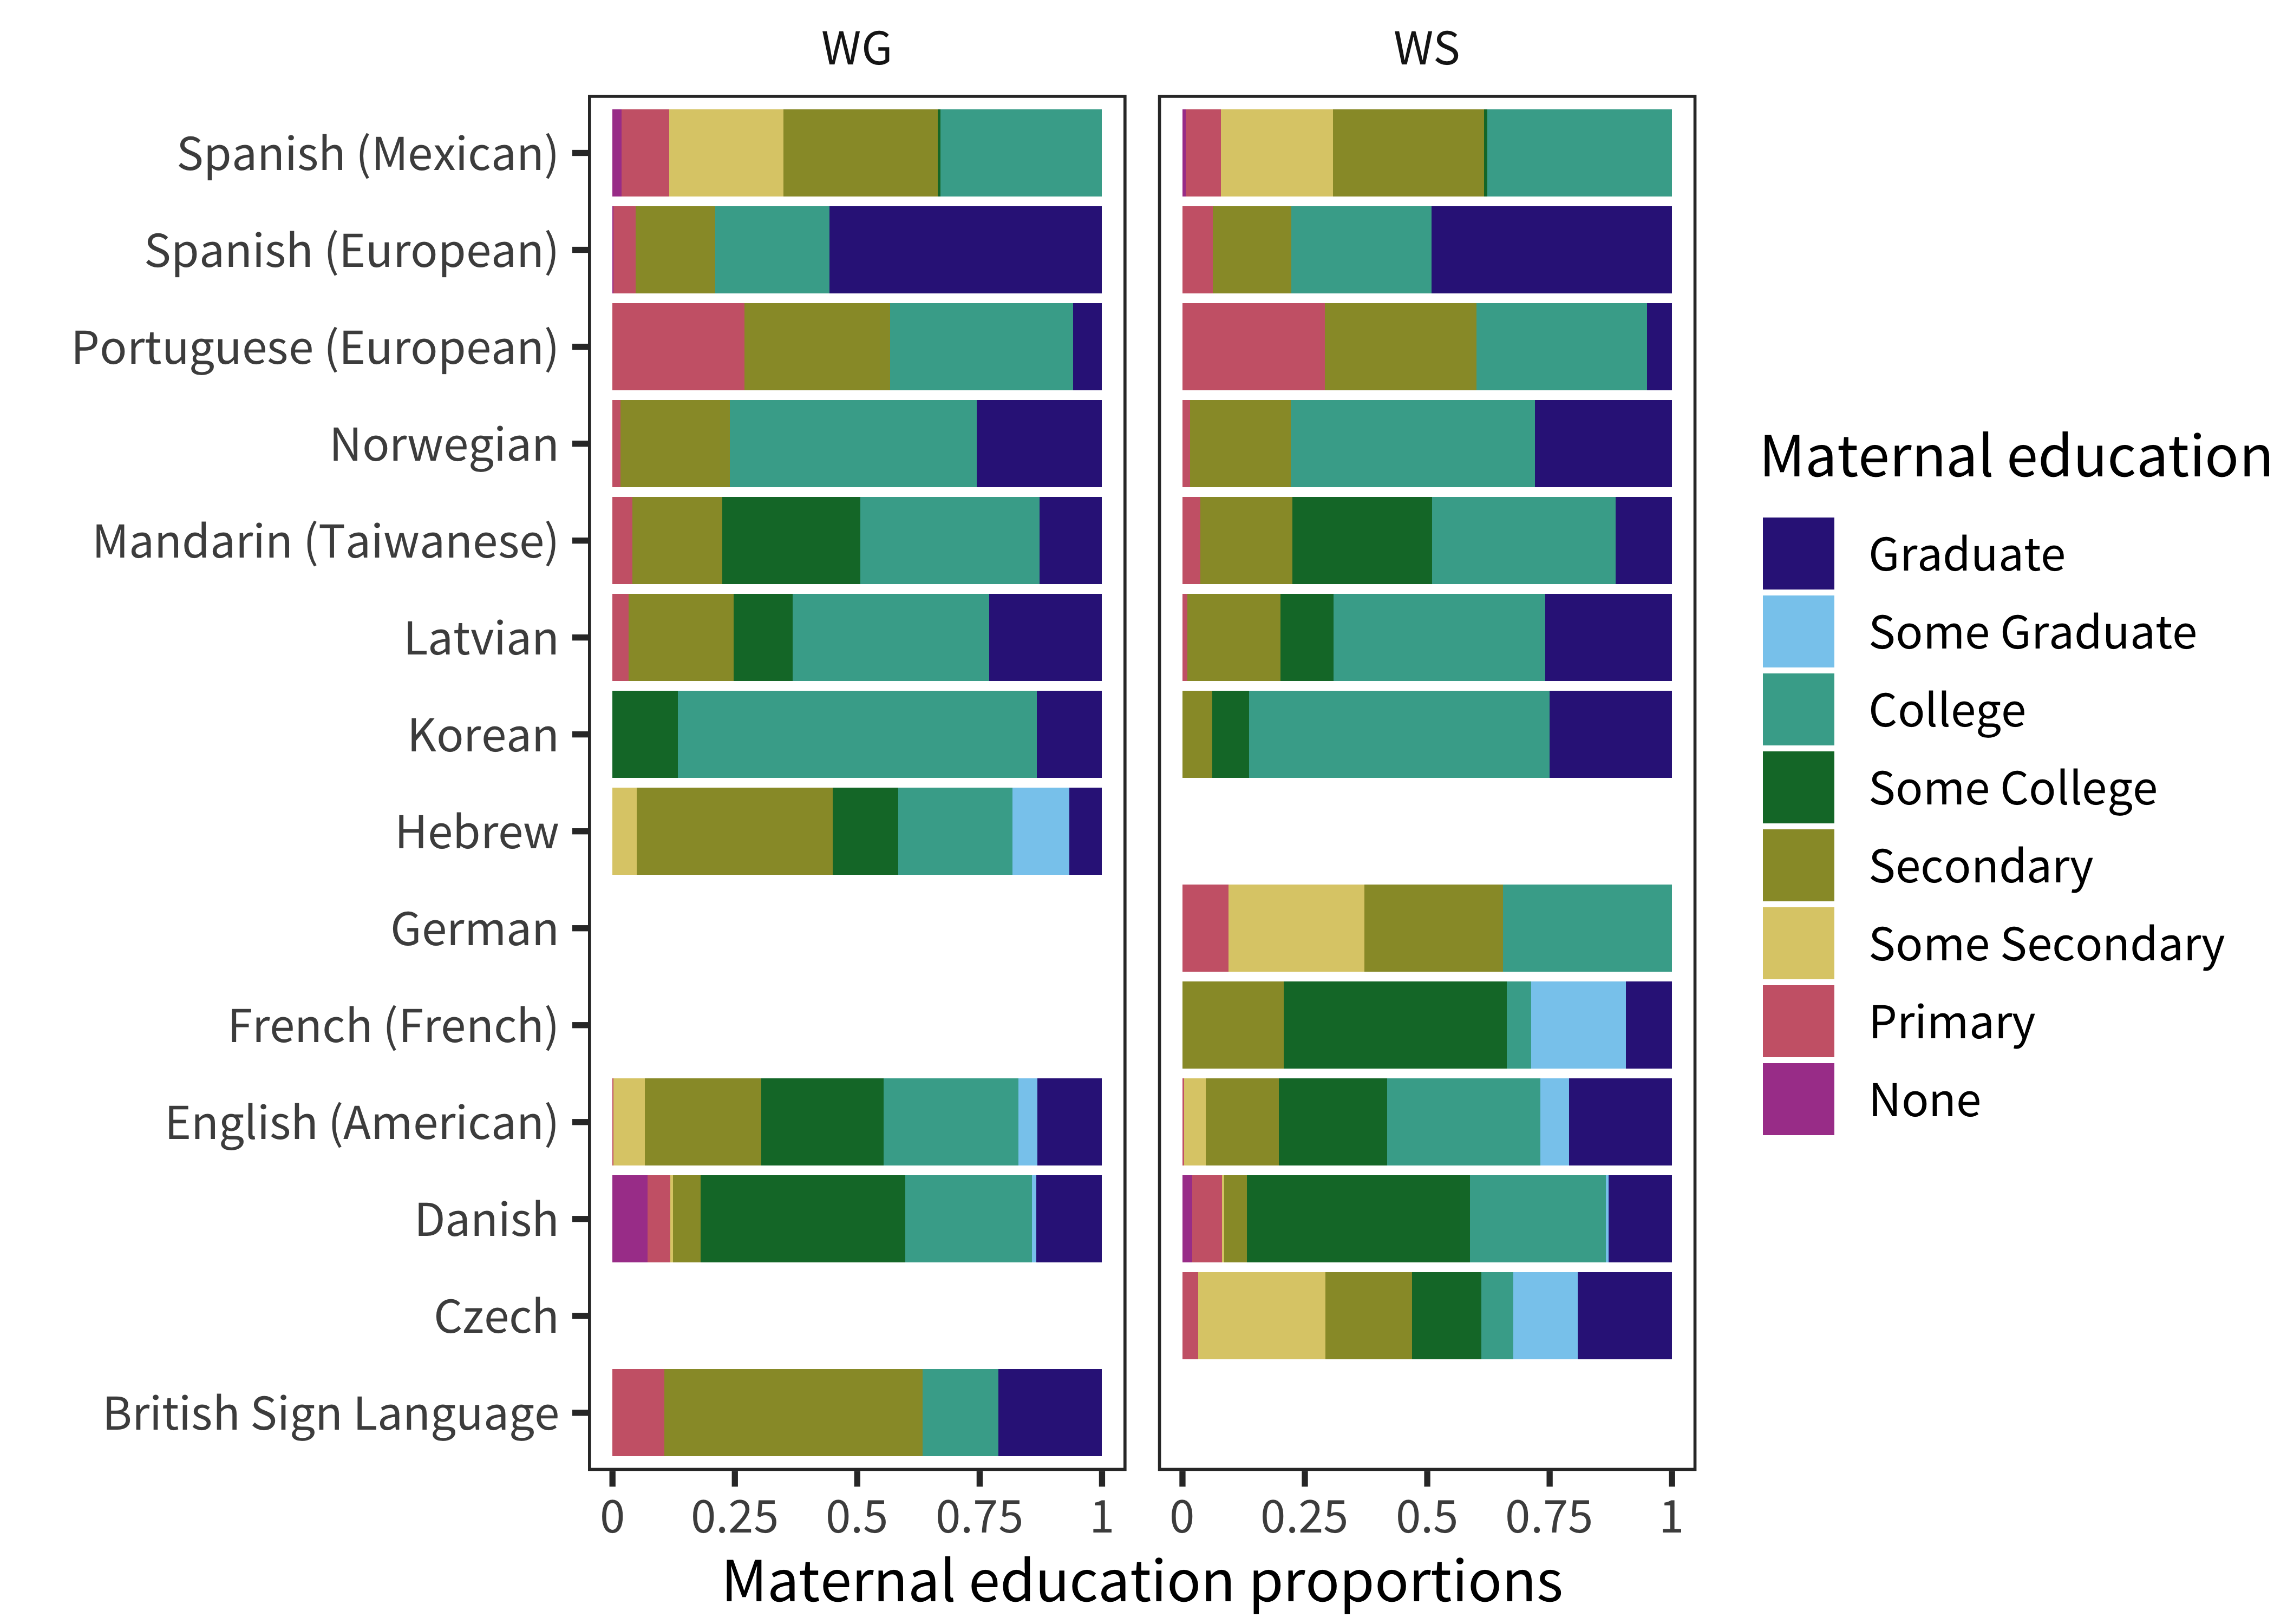
Figure 3.3: Proportions of children with each level of maternal education for each instrument.
Although we have maternal education data for far fewer datasets, there are also substantial differences between datasets on this variable (we will also return to this issue again in Chapter 6). Analyses of this variable are complicated by different reporting formats: for example the German and Mexican Spanish datasets have no separate categorization for graduate education. That said, even for datasets with the most fine-grained maternal education breakdown, we see substantial differences in distribution.
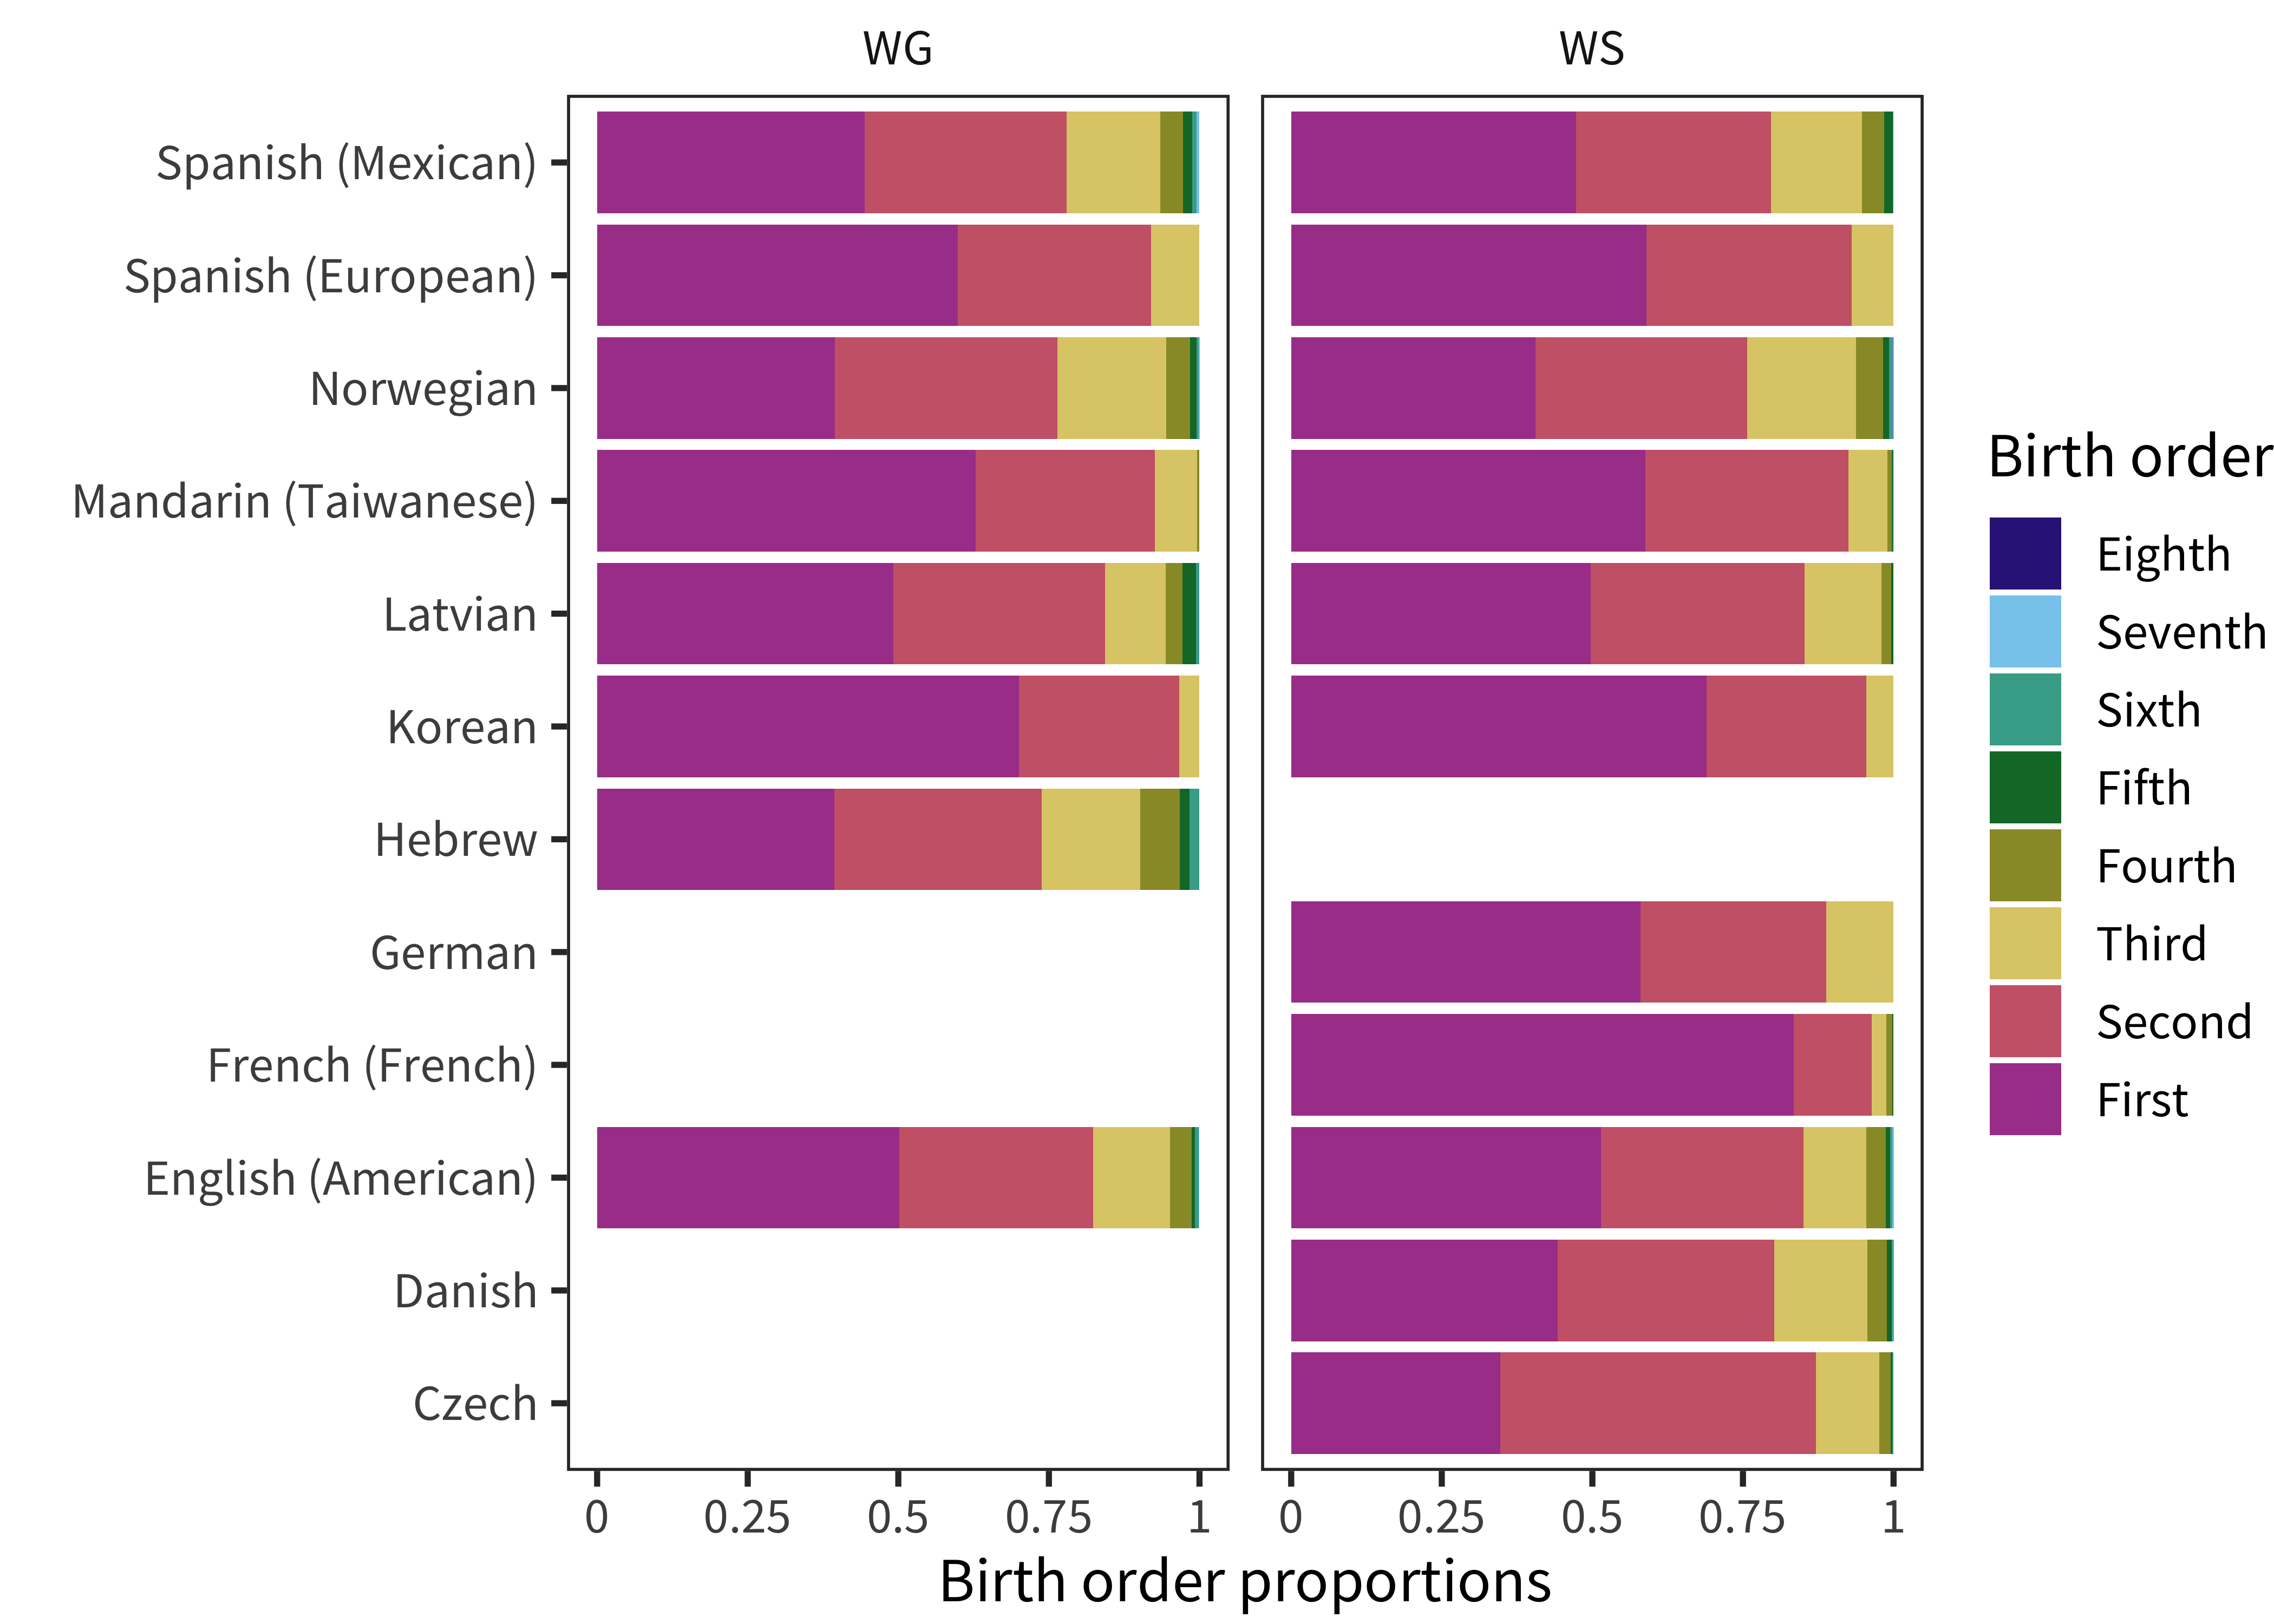
Figure 3.4: Proportions of children with each value of birth order for each instrument.
Finally, when we examine birth order, we also see differences in the proportion of children who are first- vs. later-born. The majority of the French sample is first-born, while the Czech sample has many more second children, for example.
In summary, our samples differ substantially in their demographic makeup. Presumably, these differences are due both to the composition of the societies being sampled as well as to the sampling procedure employed by the researchers.
3.2.5 Longitudinal vs. cross-sectional data
The strongest developmental inferences can be made by the examination of longitudinal data, in which children’s individual development is measured multiple times using the same instrument. Unfortunately, relatively little of our CDI data comes from this type of repeated administration. Figure 3.5 shows the number of administrations for particular languages that come from longitudinal datasets with a particular depth. There is a substantial amount of two-administration longitudinal data for several languages, but only a few have more than two observations for individual children.
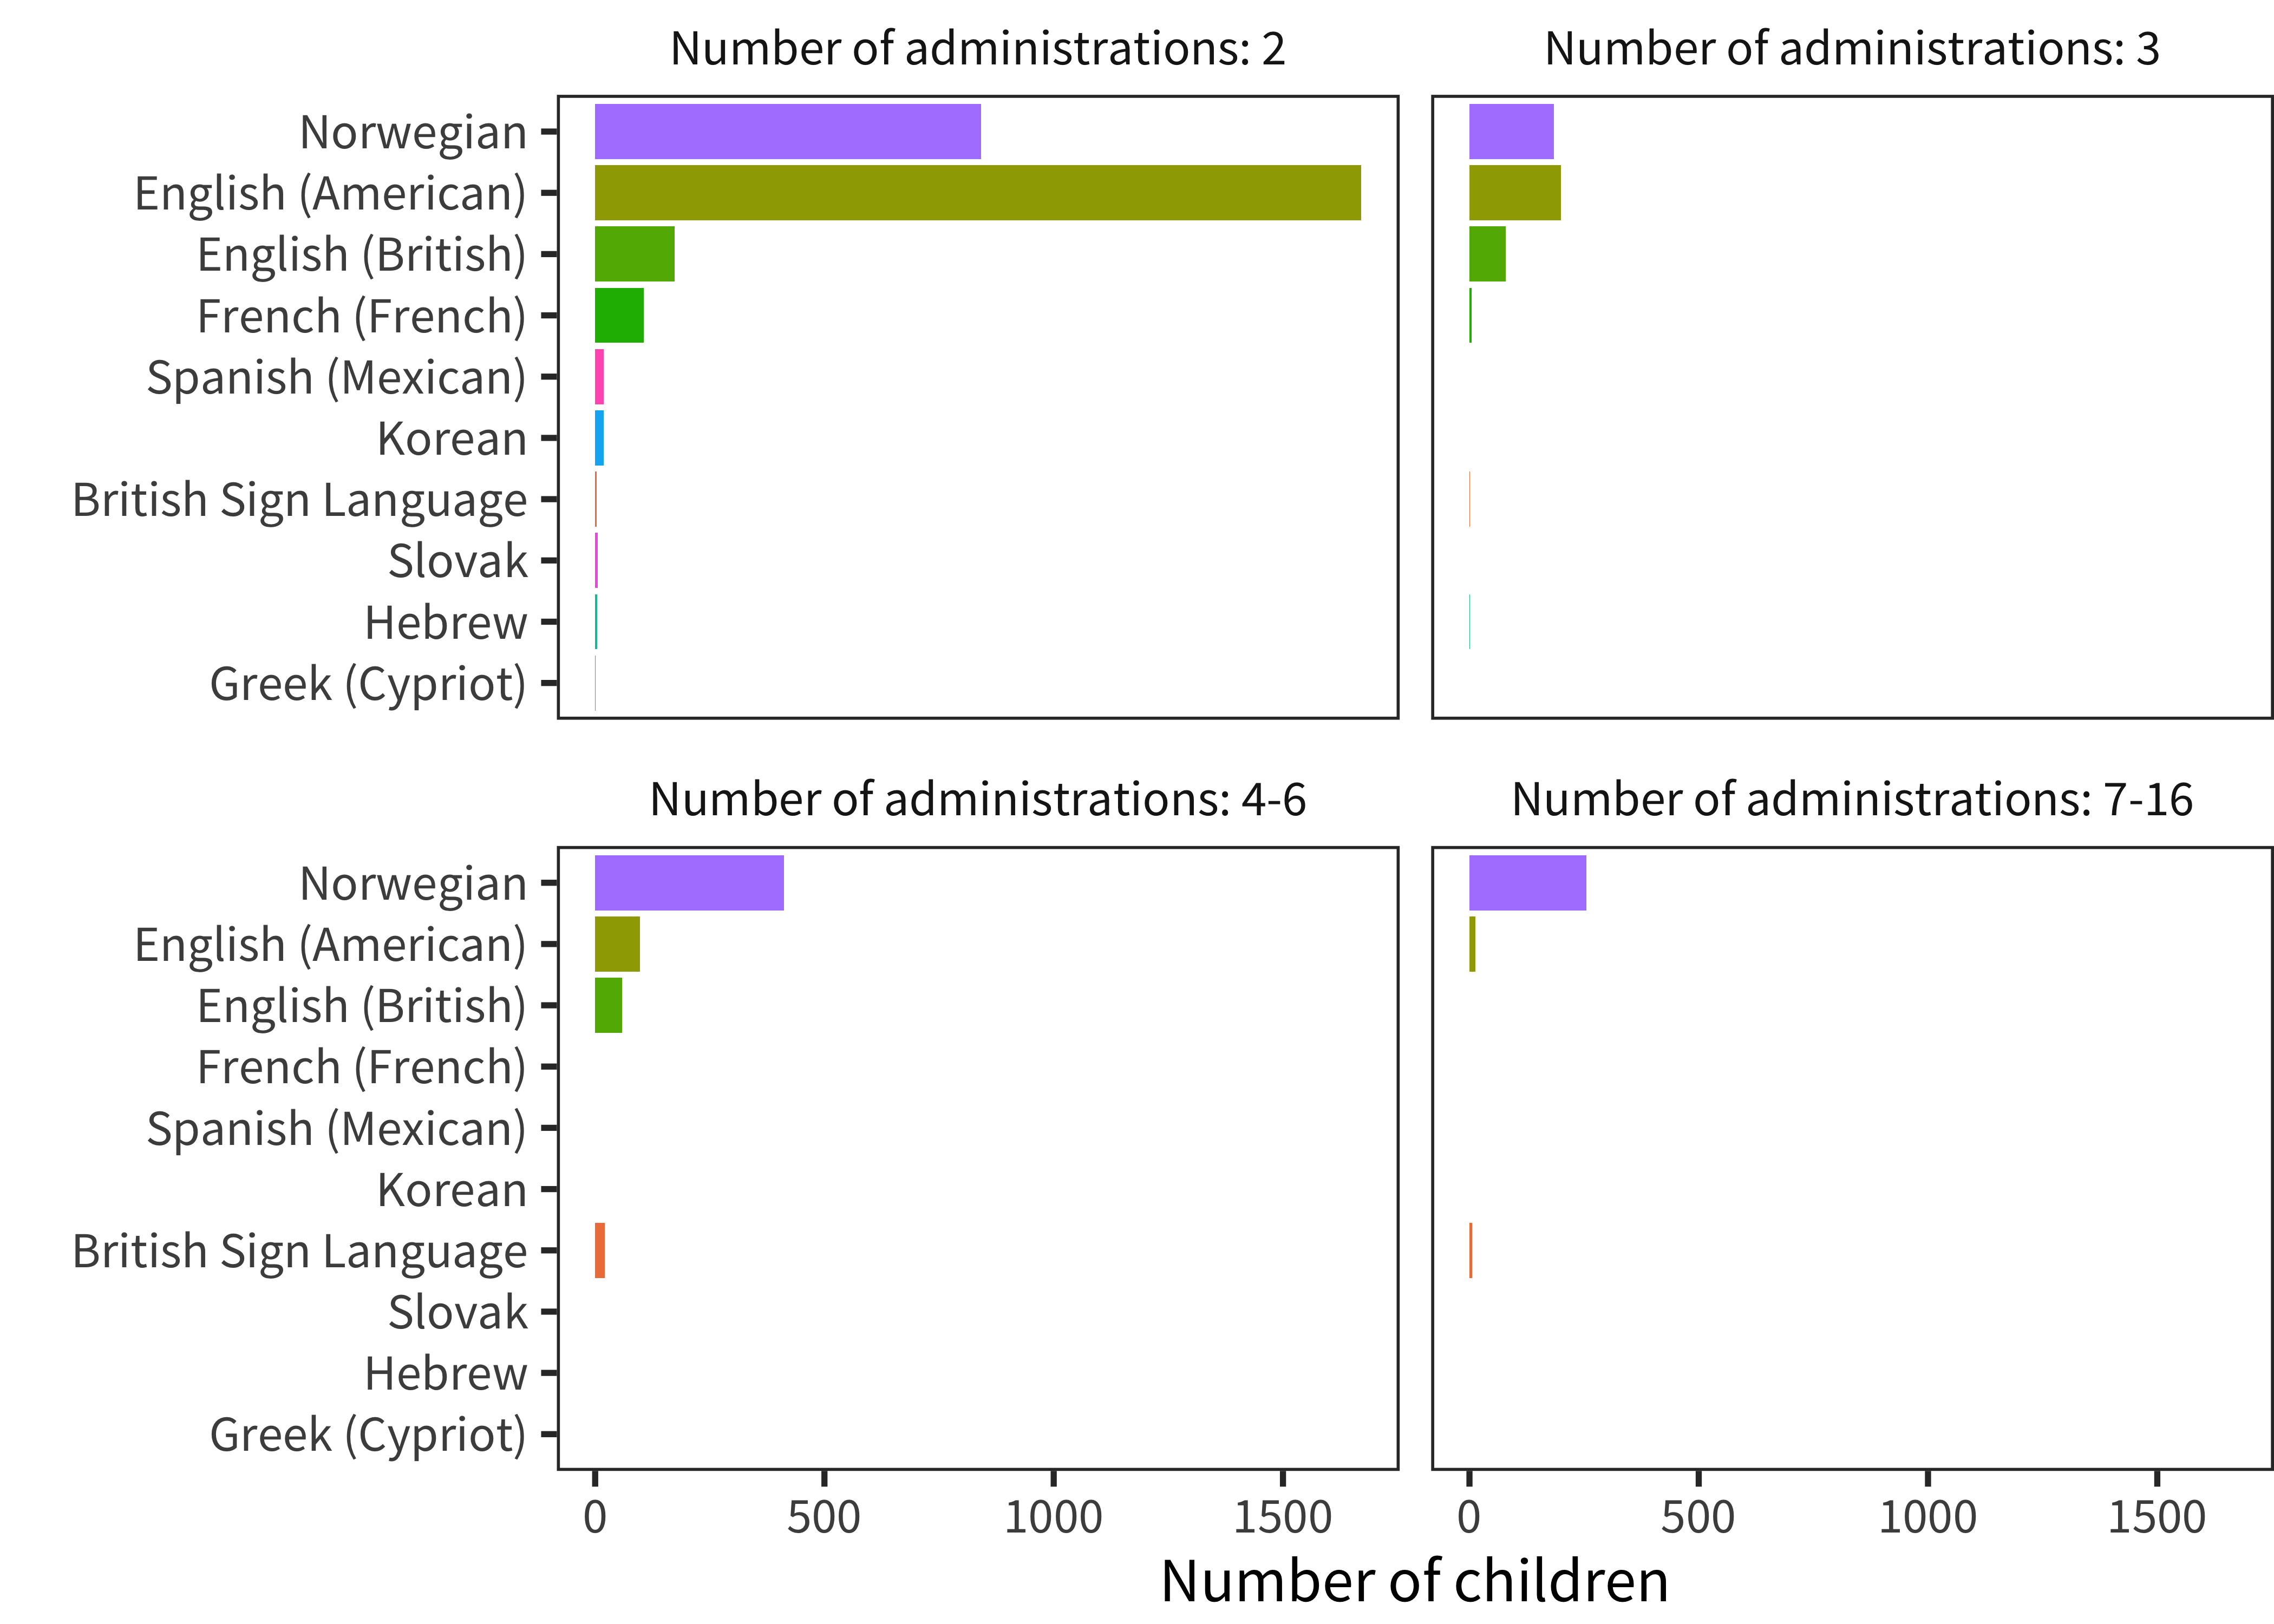
Figure 3.5: Number of children for whom there are multiple administrations per instrument, split into bins.
In general, this aspect of our data is a consequence of the fact that, for normative datasets, pure cross-sectional data collection is used to ensure statistical independence between datapoints. Thus, we must typically settle for using the large amount of available cross-sectional data to average out individual variability. We do use the more extensive Norwegian and English longitudinal data in Chapters 13 and 15, however.
3.2.6 Difficult datasets
One feature of dealing with data from such disparate sources can’t be glossed over. There are “difficult” datasets – data that do not make sense with respect to our other analyses. This short section documents some of these issues (helping itself more intuitively to a few visualizations that will be developed in more detail in subsequent chapters).
In general, our approach with respect to these data is to embrace the messiness of the data we have. While it is very tempting to remove specific datasets from consideration when they deviate from our expectations, this practice creates a strong circularity in all of our inferences: they will be estimates of variability or consistency stemming from cases where we ourselves have imposed certain consistency standards on our data. While there are some cases where we have a relatively likely explanation close to hand for the pattern we observe in the data, unless we can confirm this pattern externally, we have chosen not to exclude these data.
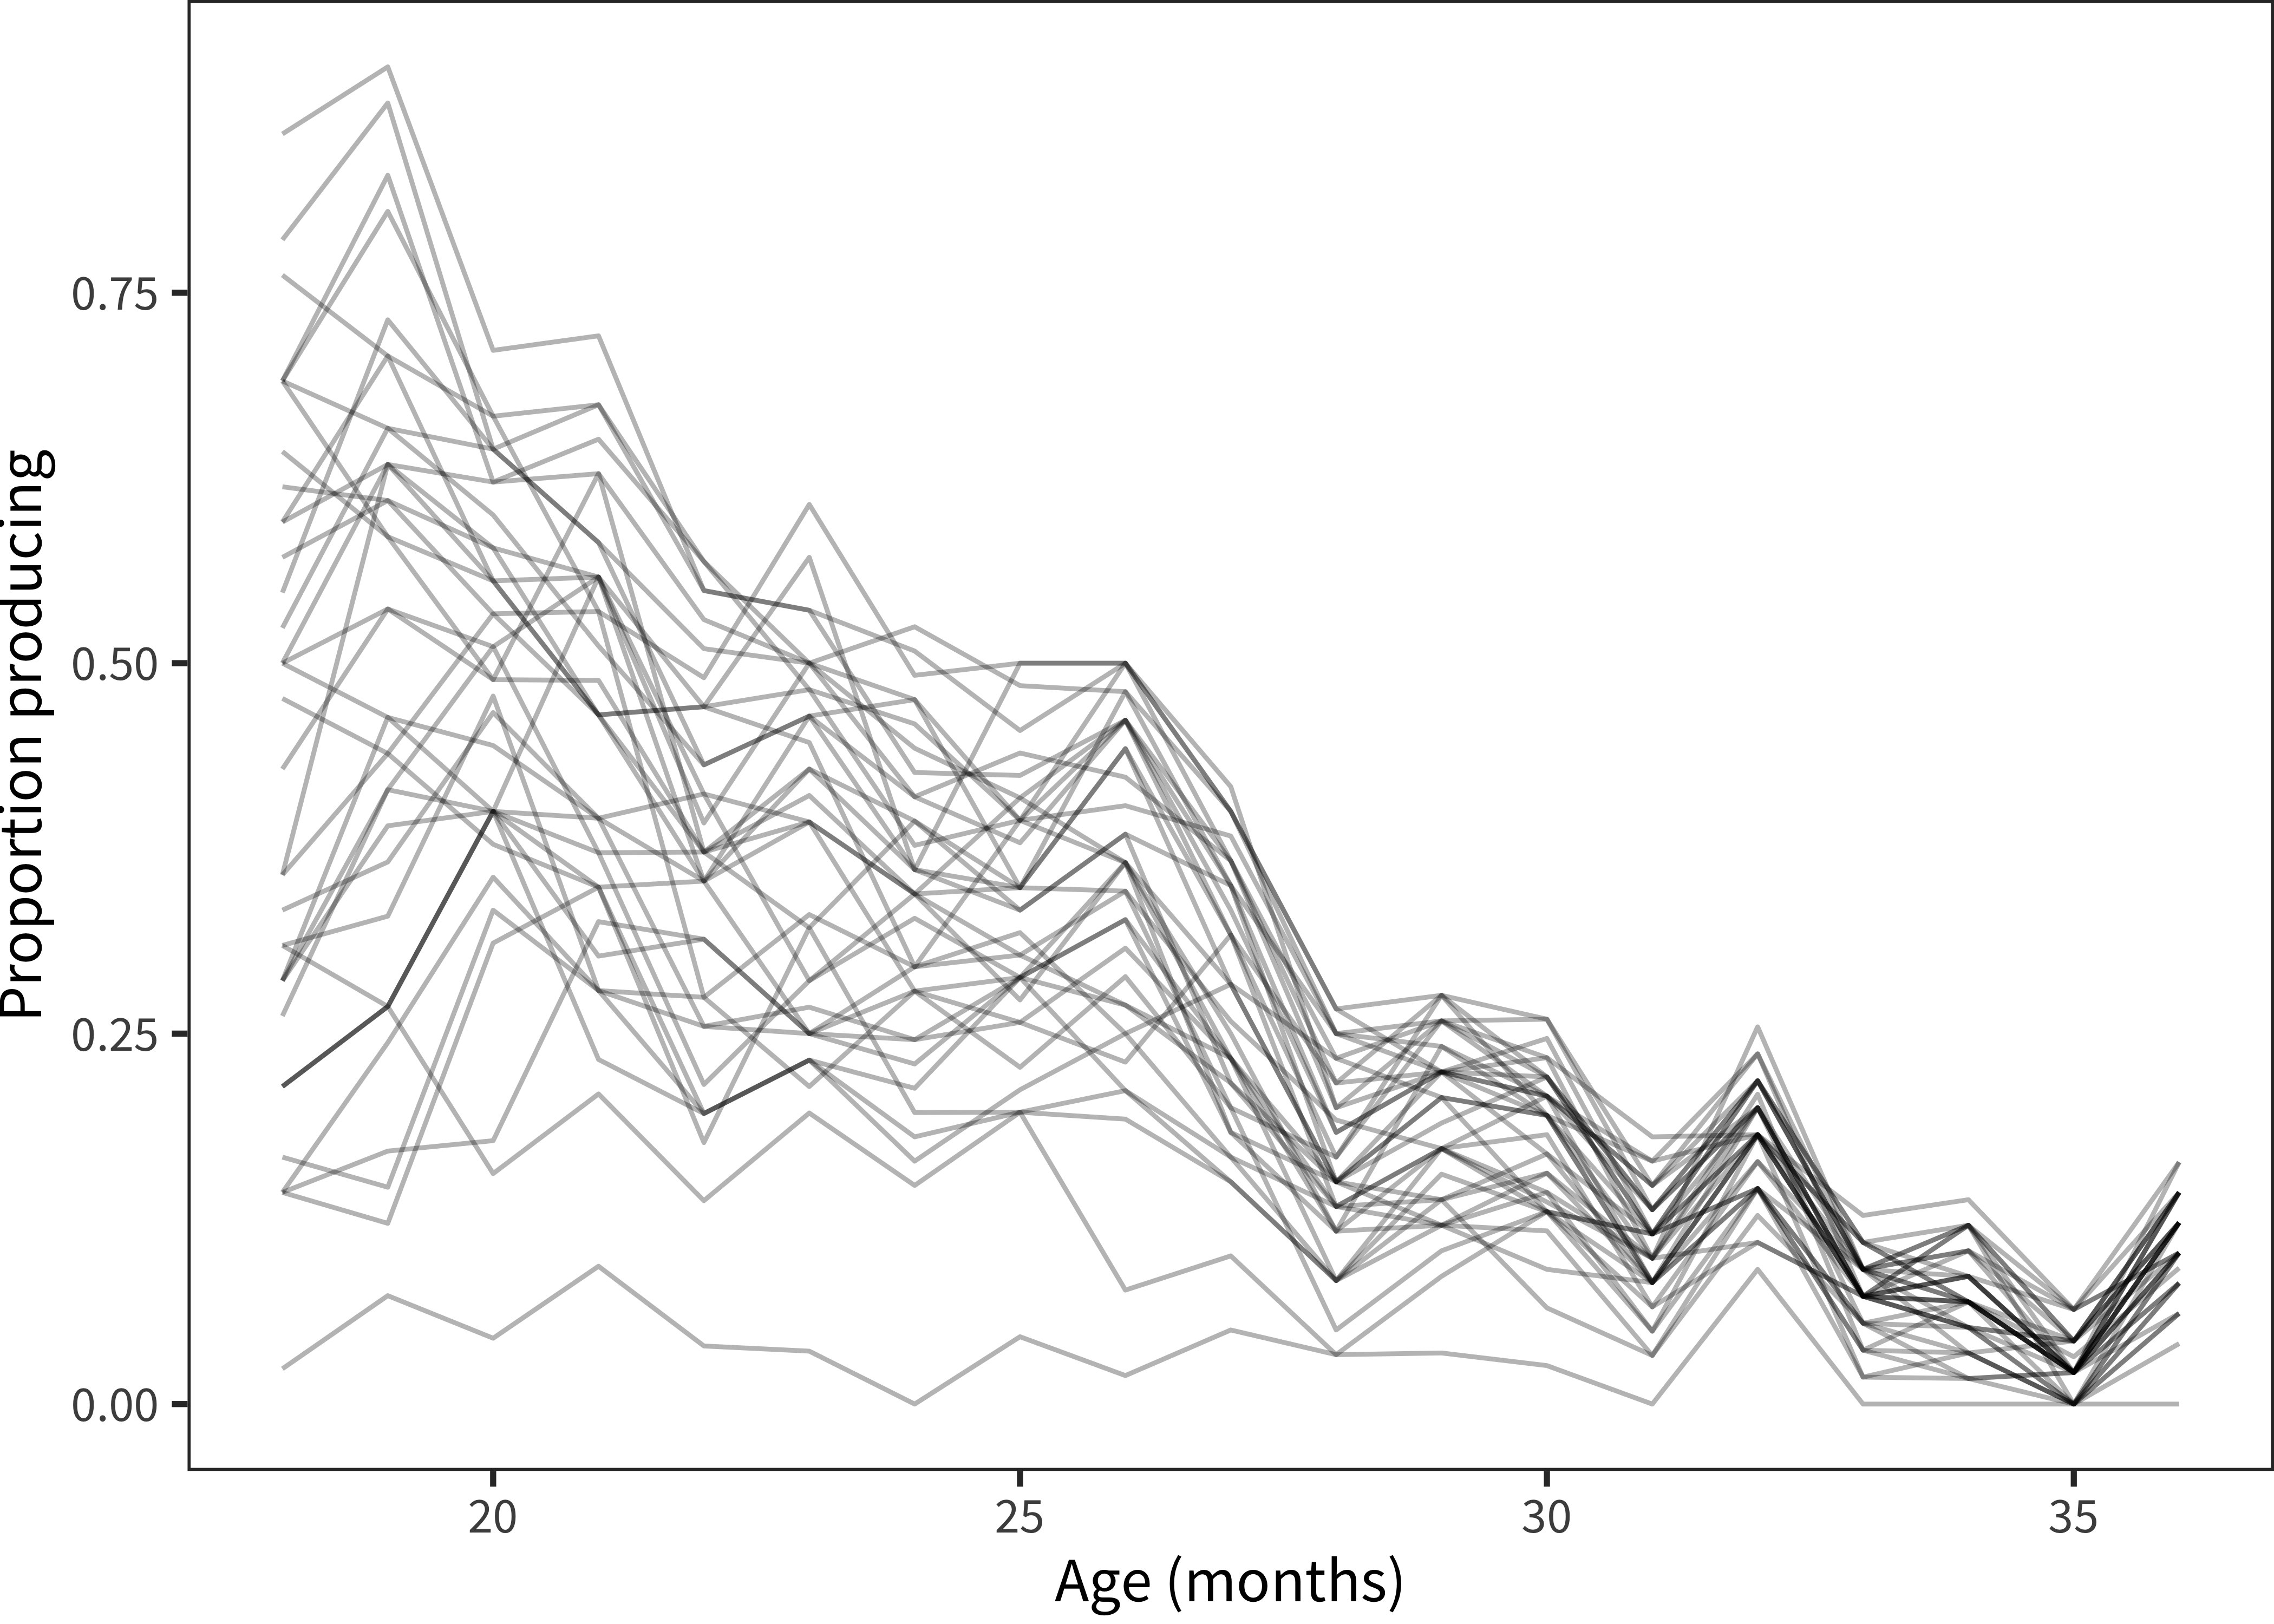
Figure 3.6: Proportion of children reported to produce each item in the Sounds category in Russian WS.
One example of this kind of situation comes from the Russian dataset. Although – as we will explore in depth – nearly every individual item in every dataset shows a positive developmental slope (indicating learning over time), Russian animal sounds are a distinctive exception, as shown in Figure 3.6. Every item in this category decreases developmentally in a very consistent and reliable way. What happened? One possibility is that this set of items was reverse coded (and so it should be asymptoting at three years). Another possibility is that Russian parents treat these as “baby words” that a three-year-old would not or should not produce (e.g., rather than saying oink they should say pig.) We can speculate but we will likely never know.
Extending more broadly (and presaging the discussion in Chapter 5), our analyses have revealed two datasets that show large disparities not just in a single category but in the pattern of overall vocabulary sizes: Mandarin (Beijing) Words & Sentences production and Mandarin (Taiwain) Words & Sentences comprehension.
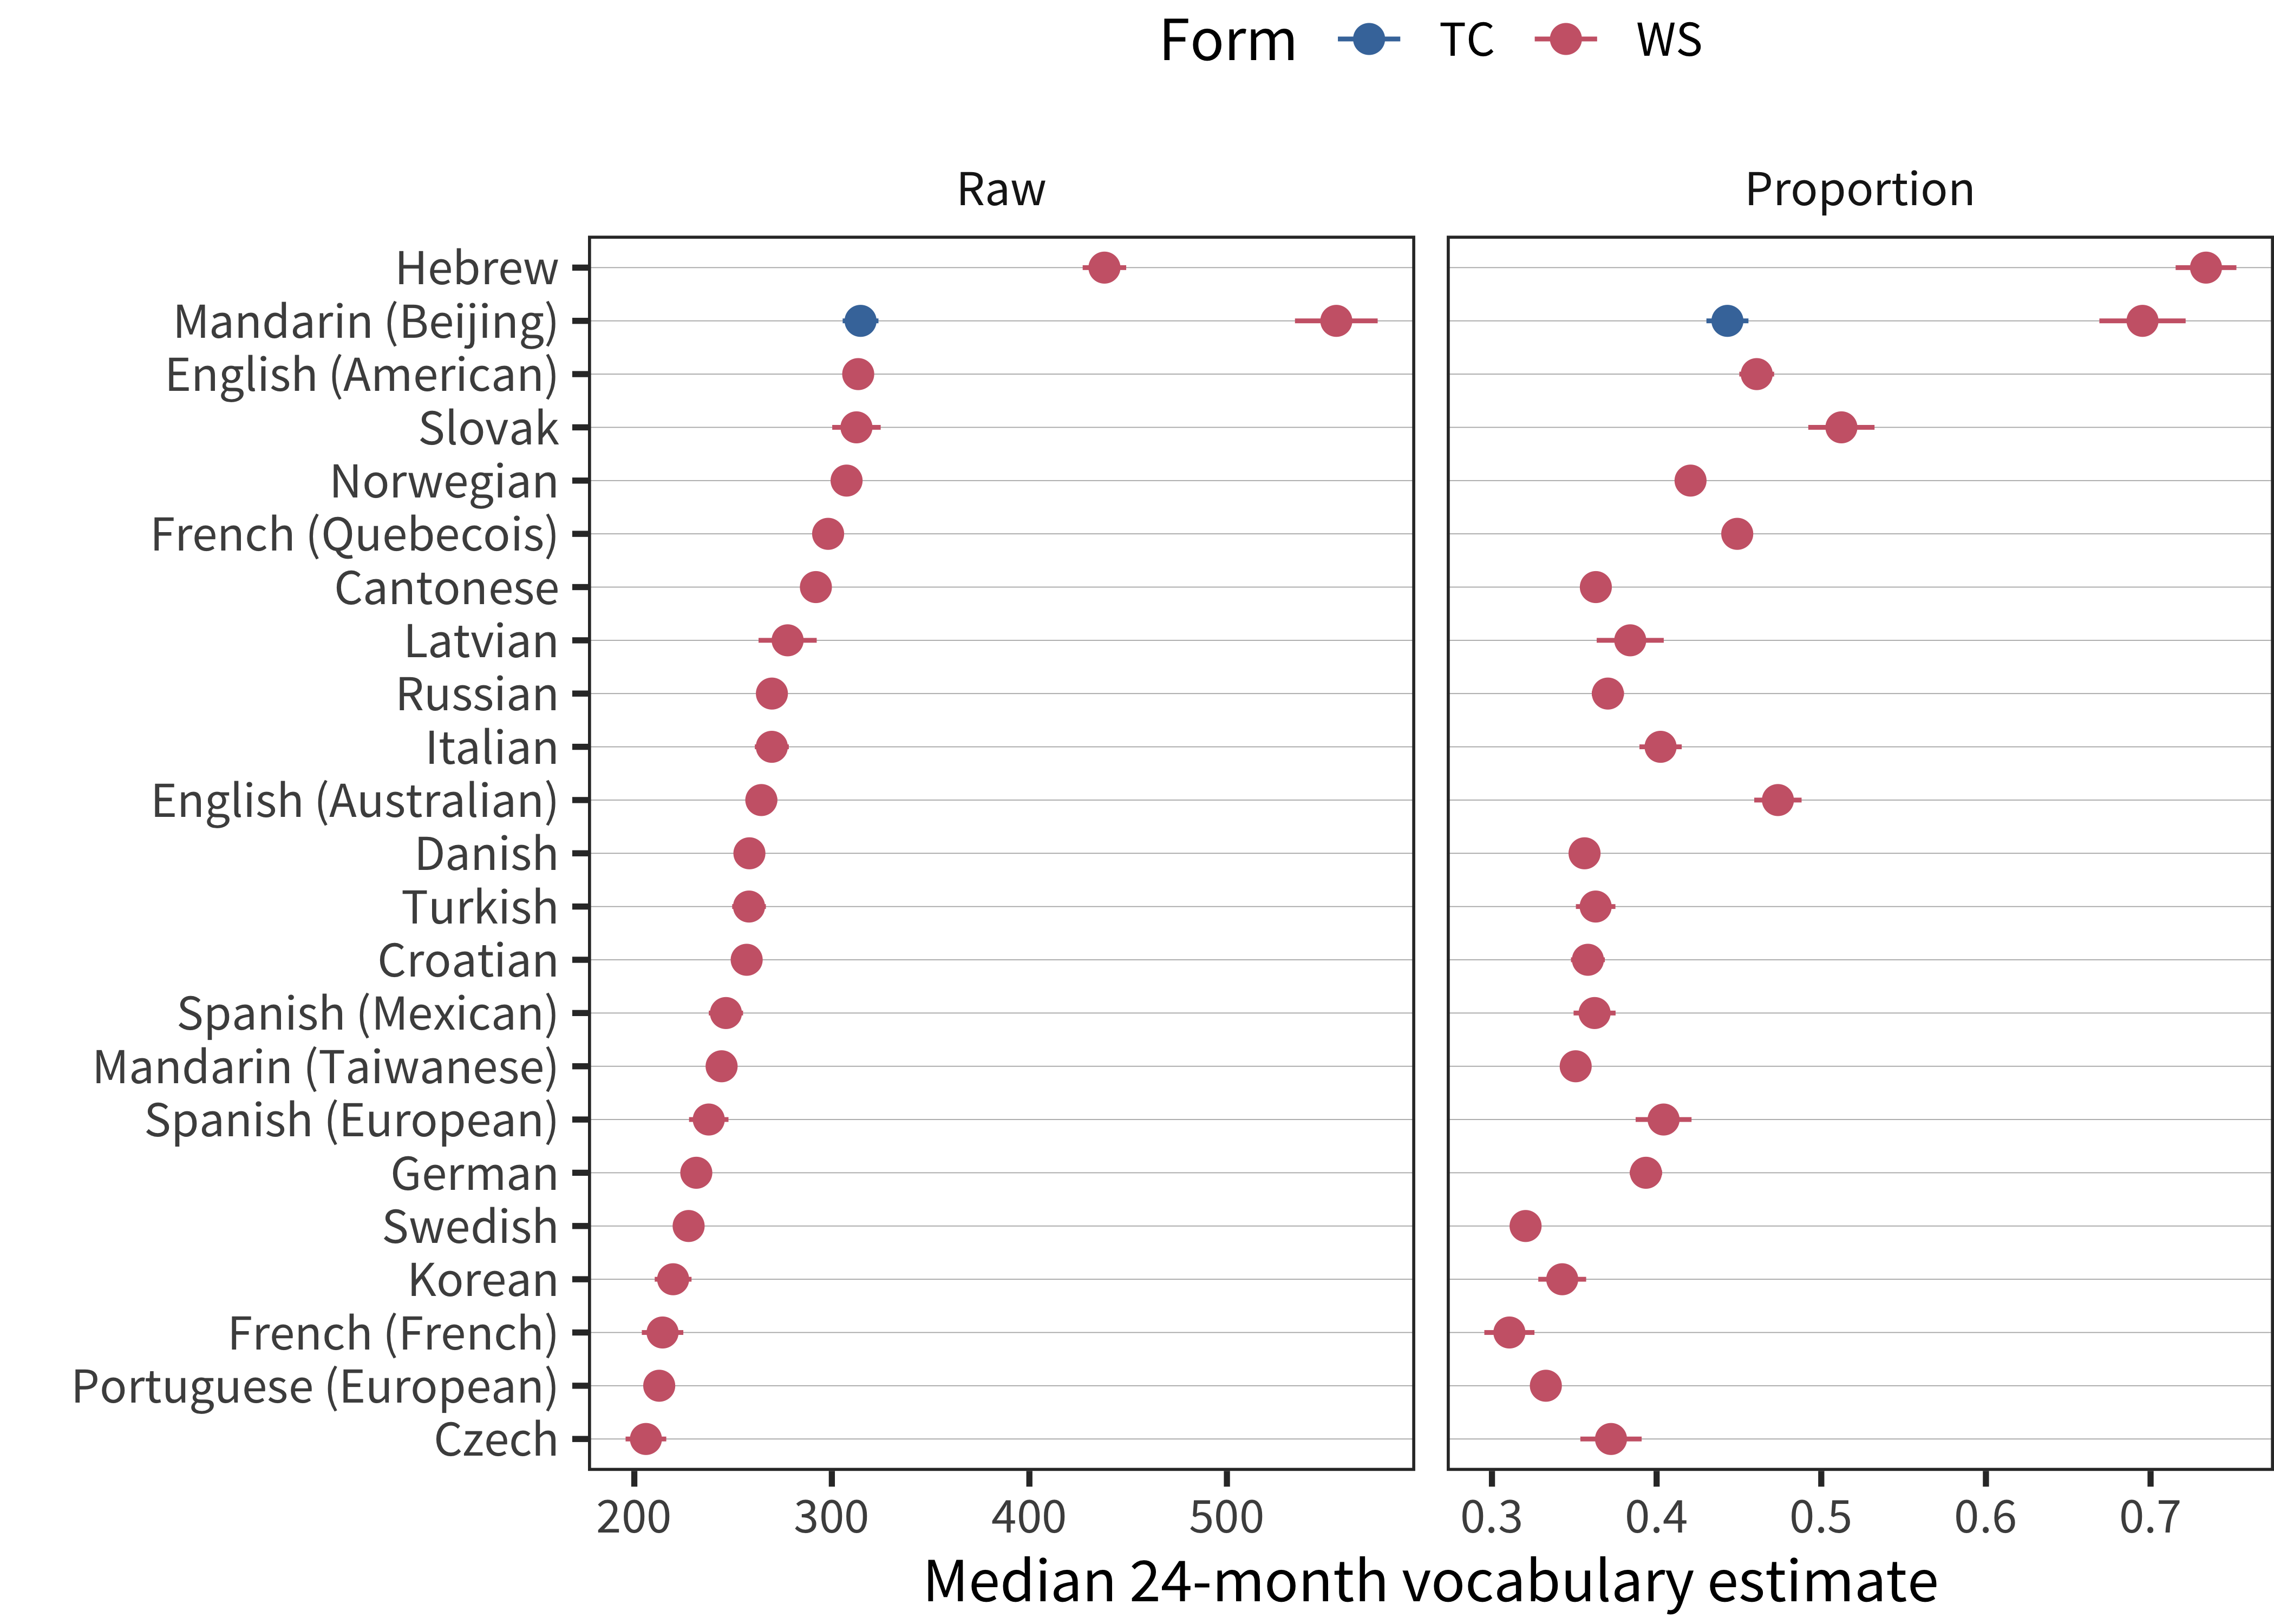
Figure 3.7: Median production vocabulary for 24-month-olds, with total item scores shown in the left panel and proportions on the right. Scores are sorted by total item score. To increase stability, the plotted value is the intercept of a linear model predicting vocabulary as a function of centered age between 18 and 30 months.
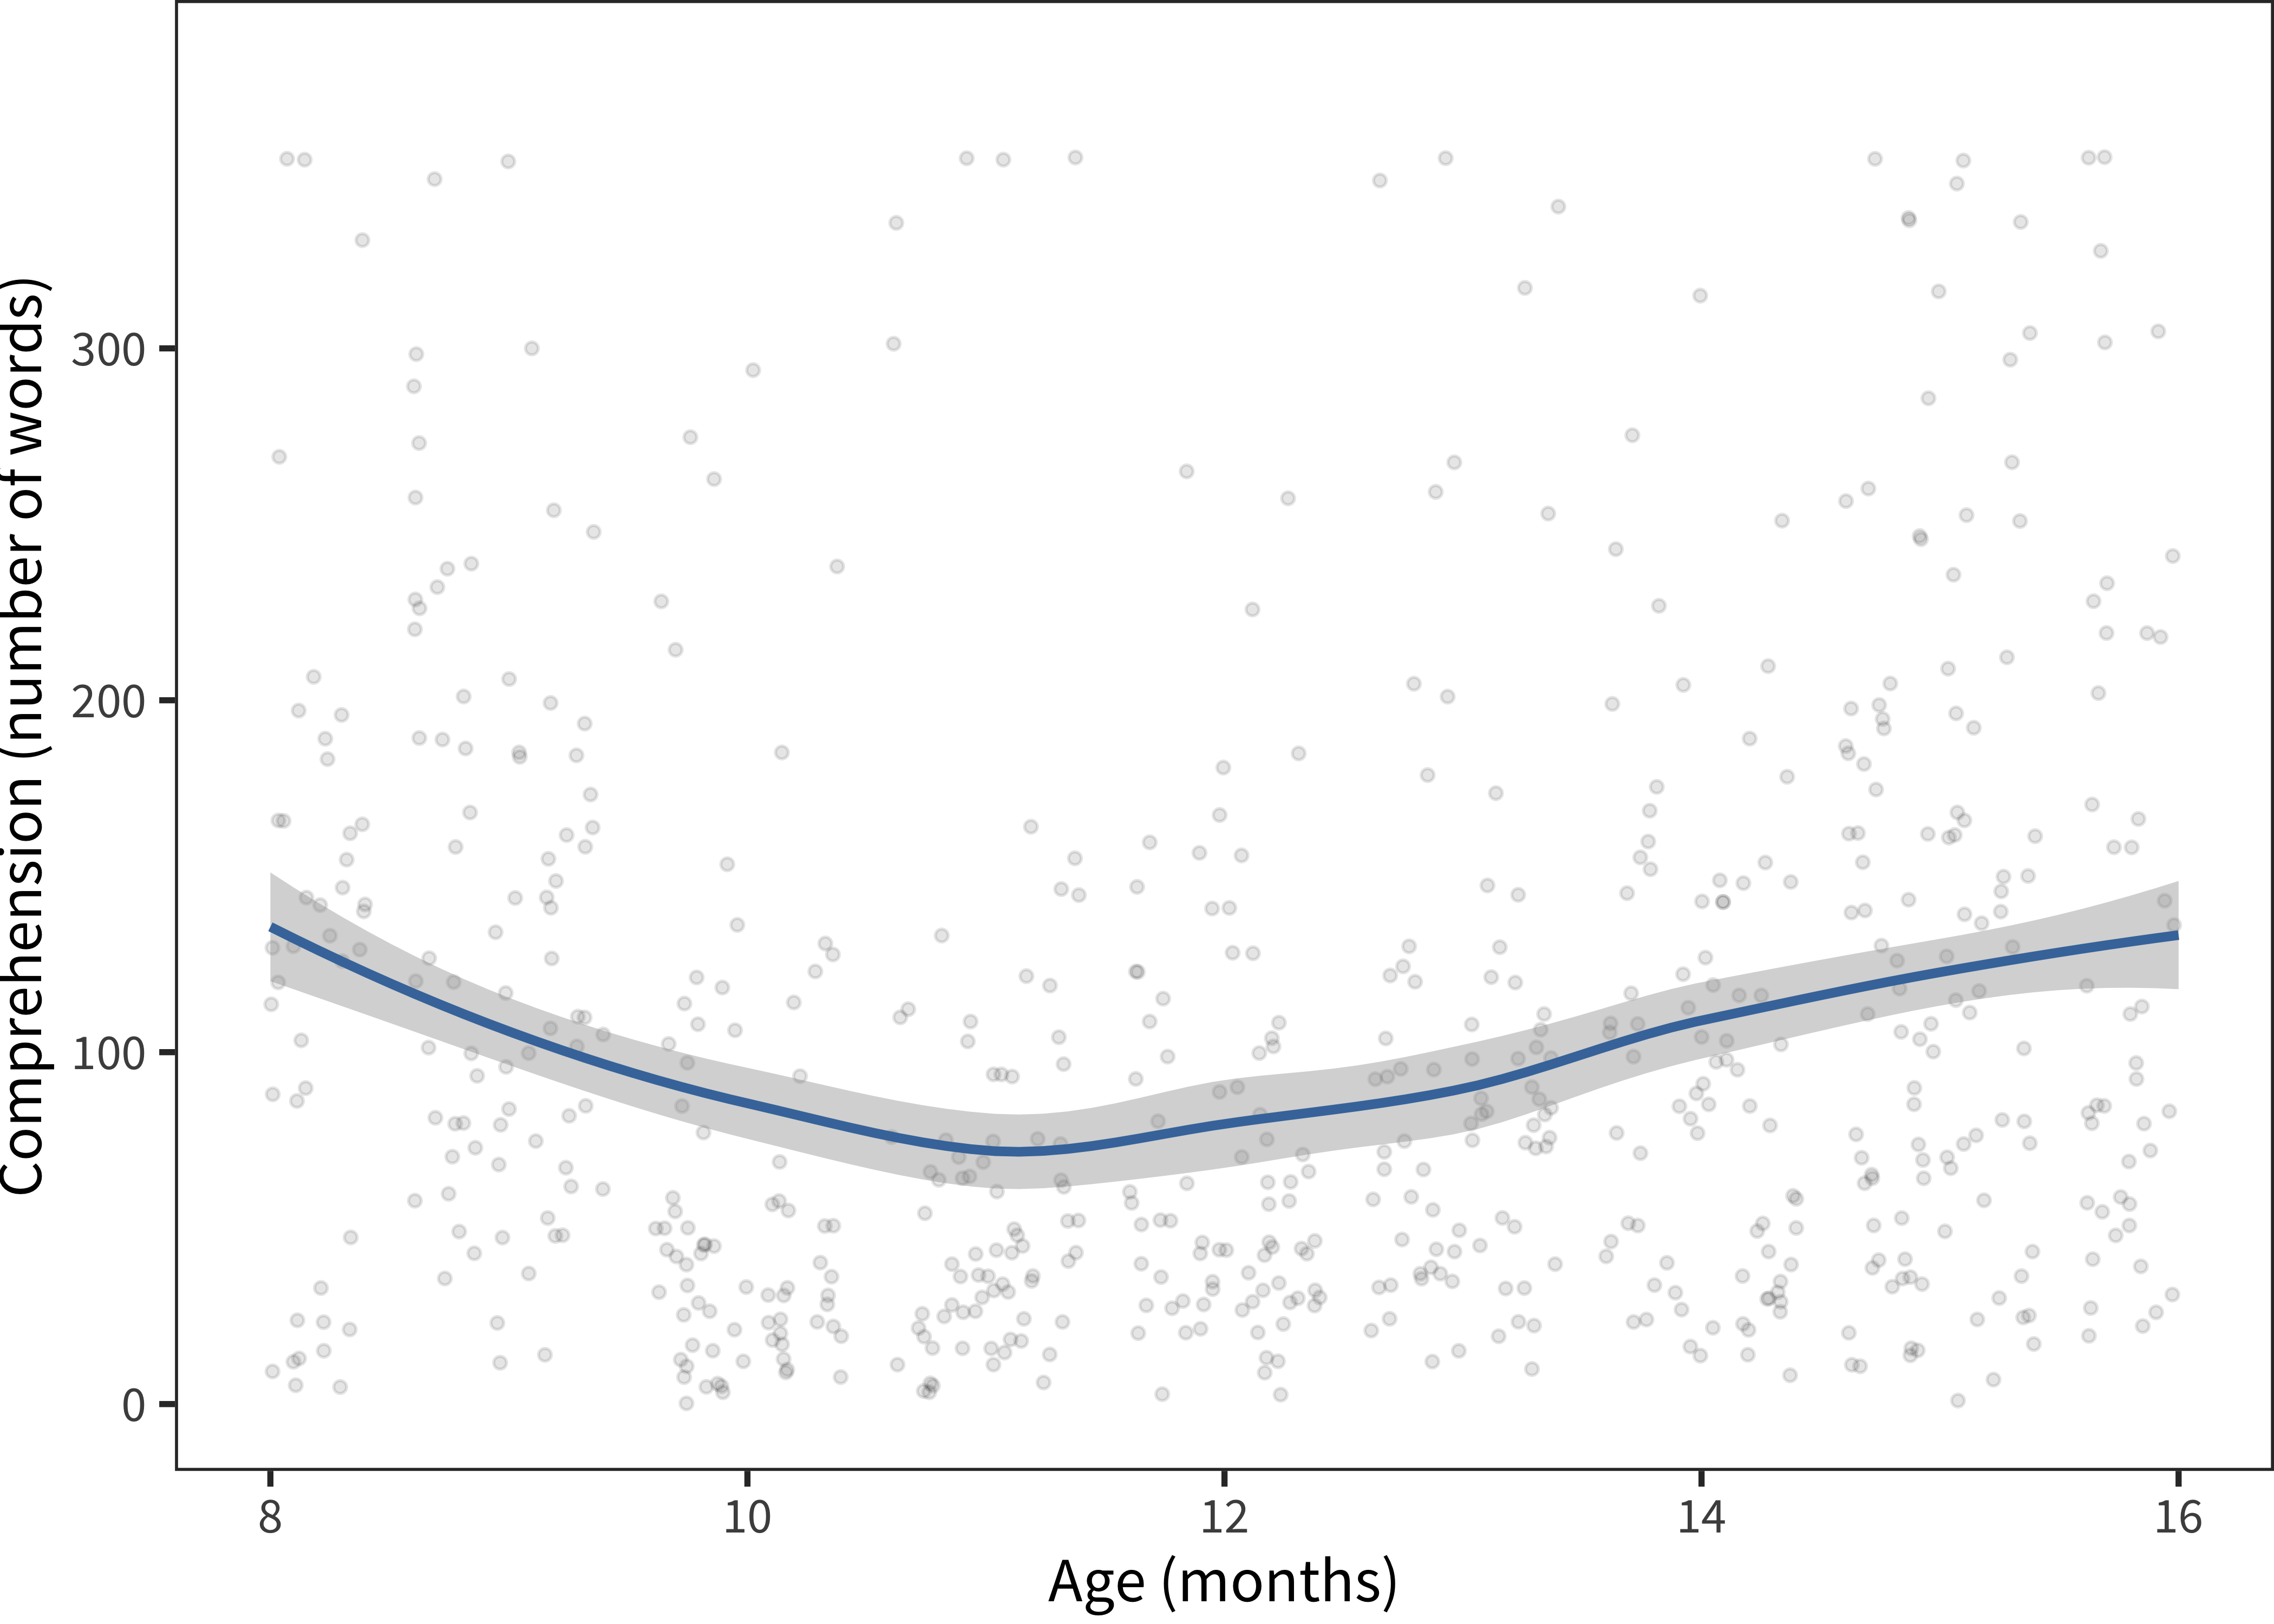
Figure 3.8: Comprehension data from Taiwanese Mandarin.
In our first example, Mandarin Words & Sentences, these data are reported by Tardif et al. (2009) in a study of both Mandarin- and Cantonese-learning children. The data reported there show a pronounced Mandarin advantage. As it turns out, this advantage is almost unprecedented relative to other languages. We plot the median production for 24-month olds in Figure 3.7. This figure reveals both how large the Mandarin advantage and the high level of vocabulary reported for Hebrew speakers as well (this difference is less striking in raw scores because of the relatively smaller number of items on the Hebrew form).
To investigate the Mandarin disparities further, Tardif et al. (2009) discussed a number of possible explanations, given that the administration and sampling procedures were similar in Mandarin and Cantonese. The children in the Mandarin sample are nearly all monolingual, only children; but these factors did not account for variation between samples. Tardif et al. (2009) therefore, speculate that structural factors regarding Mandarin (e.g., phonological structure relative to Cantonese) might be accounting for the Mandarin advantage.
These speculations seem unlikely in light of the data presented here. First, and perhaps most importantly, the same magnitude response is not shown in the data from the analogous WS Checklist questionnaire of Hao et al. (2008) (blue points). Second, this unusual trajectory is not apparent in the production data from the Mandarin Beijing WG form. Finally, given the surprising difference between Mandarin and all other languages in the sample, pure phonological factors seem unlikely to account fully for the differences. These differences thus remain somewhat mysterious; perhaps some quirk of administration instructions led to relative over-reporting, or perhaps the populations being sampled truly were different. Alongside the Hebrew data, these data serve as an important caution against simple cross-linguistic comparison in raw scores or even percentiles.
Turning to Mandarin (Taiwanese) comprehension scores, we see that they are relatively flat and show very high medians very early in development. Deeper inspection of the full distributional pattern (Figure 3.8) suggests that there is relatively little developmental change in comprehension scores on this dataset. In contrast, production appears to follow a more typical pattern. In our experience, this pattern results from parents who do not understand what is being asked on the comprehension section of a form; sometimes they report whether they think a child has heard a particular word, or whether they respond to language in more general ways. We have observed a population of “over-responders” of this sort in a number of self-report contexts – often they are parents of very young children who appear loathe to return a form having checked essentially no items at all. But such an explanation is only speculation.
We could give other examples. There are quite a number of “difficult datasets” in one way or another in Wordbank. While we have offered some tentative explanations of a few features, these are necessarily post hoc and rely on our assumption that they should be relatively similar to other datasets from other cultures and with other forms. Thus, in our further analyses we choose not to omit these data but instead consider them as a caution on making strong inferences from variability rather than from consistency. As we discussed in Chapter 1, variability may be caused by a wide variety of sources; it is consistency which is all the more surprising in the face of this sort of variation.
The specific direction they were given was: “We’re looking for the best English translation of these words. These are words that are among the first words that children learn, so your translation should be closest to the meaning of the word as it would be used by a young child (say, under 3 years old). For cases when there are two equally good English words, put both. If you don’t think there is a good translation into a reasonable English word that a kid might know, you can leave the alternative translation blank.”↩︎
In a check for errors in the re-keying of one Korean dataset, we found that there were 4 incorrect fields in 10 full records for an error rate of ~0.06%.↩︎