Conduct MA
Build a MA
Choosing the right MA question
How do I define my MA question?
Choose the appropriate level of detail for your MA topic. The topic of your meta-analysis should be broader than the one of a single experiment (e.g. “How do babies segment words of different stress patterns?”), but narrower than a whole research field (e.g. “How do babies learn language?”). The goal is to be able to gather comparable papers, measuring consistant dependant variables, to allow you to compute a common statistical metric (i.e. effect size) from them.
Define your population of interest precisely. Homogeneous can mean many things; age, language, typical versus atypical. You may run a meta-analysis where you accept many different levels for some of the variables and see how it affects results, defining them as MA moderators, for example seeing if effects are consistent across ages. There should still be some unifying element in your studies though so you have one broad result of your meta-analysis.
Consider the number of available studies on your topic. Your MA topic also depends on how many studies have been done on it. If you want to run a simple comparative MA, as few as two studies could be okay. But if you want to run an analysis with a lot of moderators, 5 studies probably isn’t enough to warrant a meta-analysis.
Why should I bother keeping track of the MA creation process?
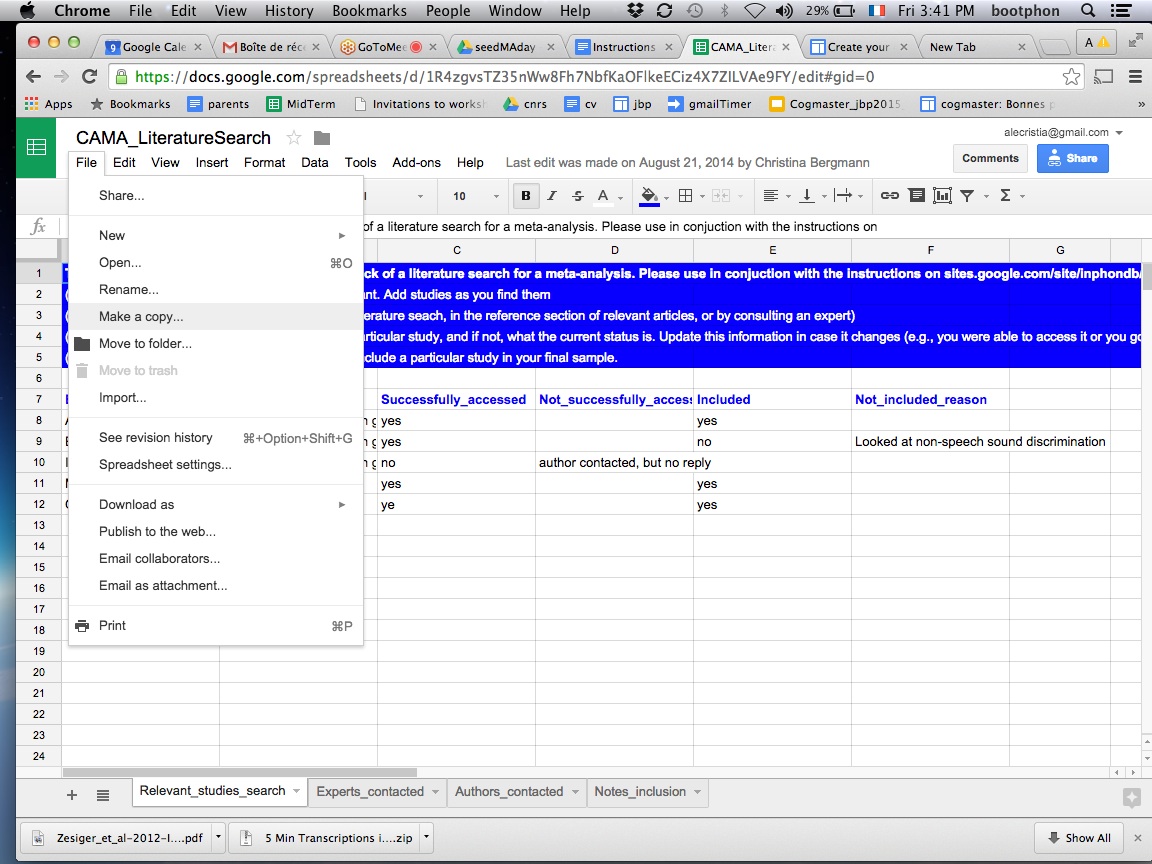
It is important that you build traceability of your work from the start, particularly since in larger MAs other people may finish up the work or you want to check later on why you decided to exclude a given paper. So to make sure that all of your decisions are recorded and clear, make a copy of this decision spreadsheet. Don’t forget to rename it, to give us a “viewing” link, and clean it up as follows.
Step 1: Click on “File” and select the “Make a copy…” option
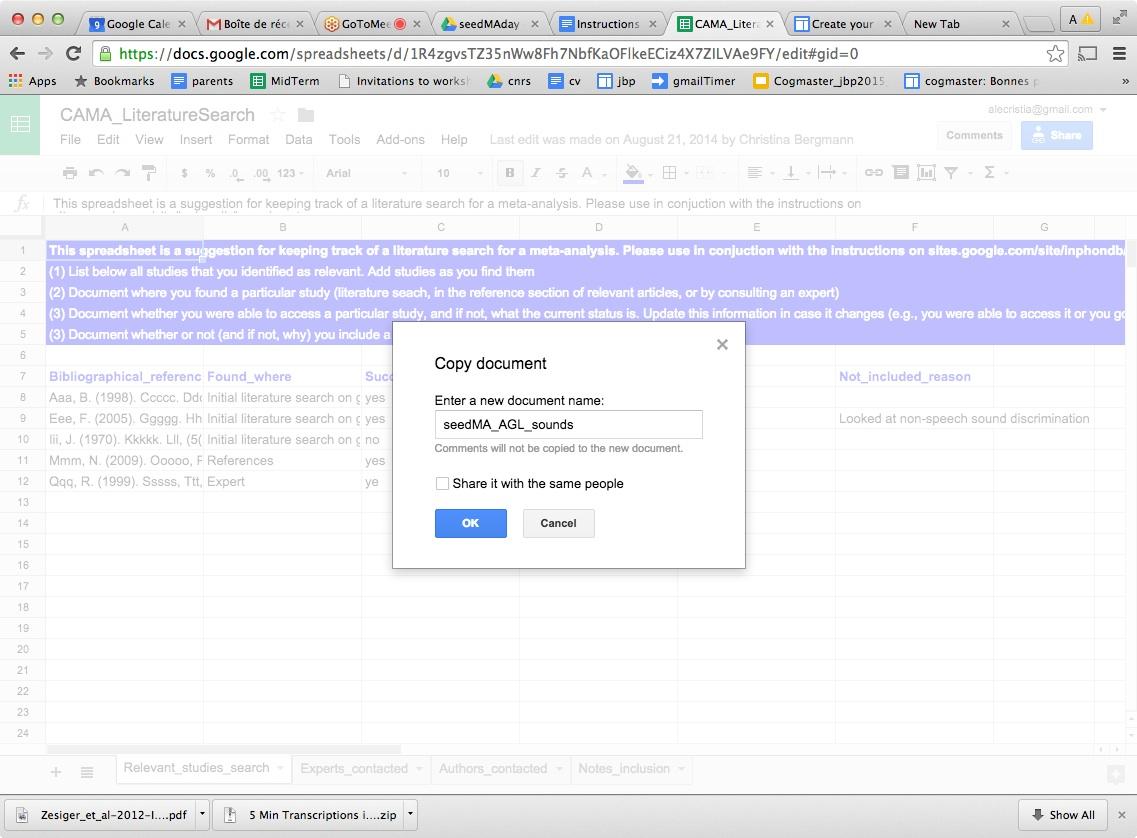
Step 2: In the window that appears, change the name to something like “MA_TOPIC”
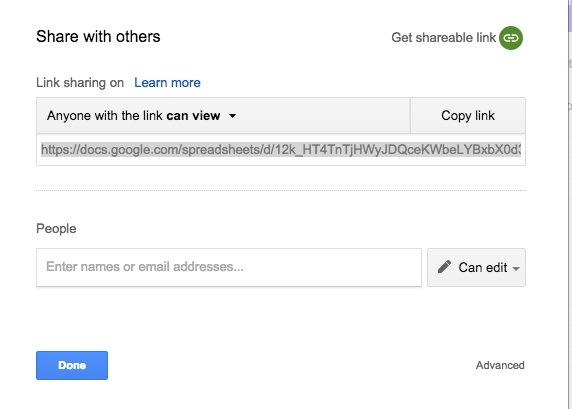
Step 3: Click on the blue button “Share” on the top right.
Step 4: In the menu, click on “Get shareable link” on the top right
Step 5: Copy the link and send it to us.
Step 6: Clean up
The model spreadsheet contains some fake entries and notes. Our recommendation is, so as not to get confused, to remove the instructions found on the top lines of each sheet and the fake information that is already entered - except for a couple of exceptions: the pink columns (A, B and W) in the Relevant_studies_search sheet contain formulas that may be useful to you. So you might want to delete the contents of the other columns and keep those two in order to reuse the formulas.
************
Additionally, make a copy of this flowchart, rename and share as you did for your spreadsheet above. This figure gives you an overview of the process, and you will be filling in the boxes with the right numbers as you go along so that people who continue this MA and/or those interested in assessing this work can make sure that you followed the procedure.
Selecting Studies
How do I select the studies to include?
The goal of this step is to put together a list of publications that you will look at and consider for inclusion. In a typical MA, you make the most comprehensive list possible in order to answer a specific research question and/or to cover a given phenomenon. This typically means going through 1,000 abstracts, and reading in full 100 papers. You can start with the seminal paper for your effect of interest, and then look for the studies citing your seminal one. Use pubmed’s search to find your pivot study’s entry, for instance by copy-pasting the full paper title in the builder:
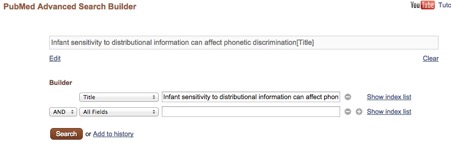
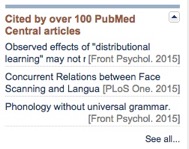
When you press “search”, usually you’ll find the entry for your seminal paper (or if the title was not unique, you might need to click on one of the entries found until you do come across the entry for your seminal paper). Notice on the right a section entitled “Cited by …” Scroll down to click on the link at the bottom of this section stating “See all..”
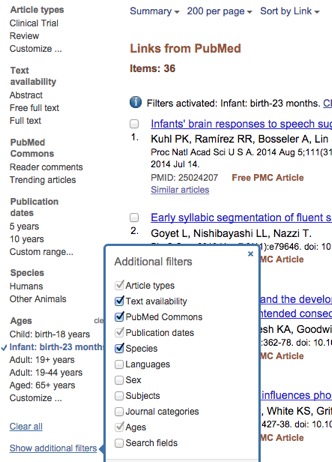
You will now see all studies citing your seminal one. Constrain it further by clicking on “Show additional filters” on the left, and checking the box for “Infant: birth to 23 months”:
You now want to save all these papers in your reference management software. If you use Zotero: Click on the drawing of a folder in your status/search bar. When you do so, a window will pop up with all the results for that pubmed page:
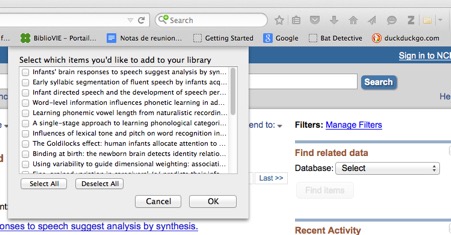
Click on “select all” and “OK”. Repeat for the other search pages. This will store the citation information, including abstract, in zotero.
You can also interrogate Pubmed with a script, such as the one we have prepared.
How exactly can I go about looking through my initial list and making decisions?
What if the title and abstract doesn’t allow me to decide?
Then play it safe and include the paper to check based on the full text.
What if the title and abstract doesn’t allow me to decide, but in fact I know the paper and I know it needs to be excluded?
Then you probably have already seen the full text of the paper, so say “yes” for the screening decision, and then “no” for the full-text decision.
How many papers should I enter?
Ideally, you would enter everything: published or unpublished, proceedings or journal, etc. However, sometimes you may want to start a “seed” meta-analysis that just gives a rough idea of an area.
In this case, how large should your sample be? Mika and Molly have done some simulations to help you decide. By and large, it looks like the more, the better – clearly estimates get more precise (confidence intervals narrow) as more papers are entered. Based on this information, we are proposing a minimum of 10 included experiments as a pragmatic first step, knowing that your estimate is not very precise.
How should I structure the data for my MA?
We are hoping that eventually all of these MAs may be included in MetaLab, so we ask you to use the MA template (create a copy, as you did in step 1), and follow the field specifications. Ideally, you would code all potentially relevant moderator variables (e.g., experimental manipulations) in addition to the core characteristics (columns in red; e.g. means). However, in the interest of time, you can get started with the core characteristics only. Remember once more to give us viewing rights (see step 1 for instructions).
What are the relevant variables for a MA, and how many input rows/columns should I make?
Here are some FAQs we have received on this:
One of my papers has a single experiment but involves both Spanish and English speakers who are tested on a native and a nonnative speech sound contrast. Should that count as 4 experiments (2 languages x 2 contrasts)?
How many rows you make depends on how the results are reported. In this case, the authors report the outcome separately for all four groups. Therefore, please enter the four groups separately; each into their own row. You can copy over descriptions of the experiment.
In Experiment 1, there are two age groups. Do I have to report the age for both groups or do I average both groups into one? If I have to report both groups, how do I report this in the input form?
How many rows you make depends on how the results are reported. In this case, the authors report an average outcome over both age groups, since they did not find a significant difference between the two groups. Therefore, please enter only one row and calculate the average age. If the results were reported separately per age group, make a
How do I retrieve studies?
In a typical full MA, you go through the whole list and only then start entering. The procedure is as follows. Go back to your spreadsheet, and for each study that has been decided as a “yes” during screening, try to retrieve the full text for the paper as you normally would (e.g., search through scholar.google.com; regular google; your institution’s library, etc.) If you cannot retrieve it, update your spreadsheet sheet Relevant_studies_search to mark this paper as “no” in column F entitled “Fulltext_retrieved”. If you want, you can contact the authors to try to get the full text from them, in which case you can note this on column G.
If you do find the full text, go through the paper to find the first experiment reported. You will enter all experiments and conditions one at a time, and fill in their information in the MA spreadsheet you created in step 4. ### How do I enter and code relevant studies?
IMPORTANT: You should work backwards from the results section: look at what dependent measures are reported fully enough that you will be able to extract an effect size from them.
The following information allows one to calculate an effect size (we are sticking to experimental designs, since most of our MAs are experimental):
between-participant studies: > Means and SDs (not SEs!) of the > dependent variable for each infant group** are all that is > required for the calculation of Cohen’s d. Sometimes, means and > SDs are not available as numbers. If there are clear figures, you > can try to estimate means and SDs using** this online > app*. If you decide to > estimate values from figures, add a column to keep track of this. > Finally, t or F values for the main effect in combination with > sample sizes can be used to calculate Cohen’s d. Note them > when available.
within-participant studies: > Effect sizes for this type of > study are calculated the same way as in between-participant > studies, but in order to calculate the weight of these studies > the correlation between the first and second measurements is > required (to account for the amount of > within-participant variation). Since this measure is usually not > reported, we provide below median and range for correlations found > in existing MAs.
Infant word segmentation from native speech: 0.641 (range: 0.140 to 0.921)
Infant vowel discrimination (native and nonnative): 0.496 (range: -0.413 to 0.855)
en entering papers, please remember a key thing: all analyses are done by machines, and machines cannot read text! So if a column is “numeric”, please do not enter things that aren’t numbers (such as text, spaces, ~, etc). This is particularly important for the dependent measures!
At this stage, you might find that a given paper does not contain the right information for being included. In this case, you can and should exclude it. If you have already started entering it, you can leave the information you entered and put in “comments” that the entry is incomplete (although if you followed our advice above, you won’t have wasted time entering it!). Remember to update your spreadsheet with each paper you read and made a decision on.
The article I enter has 3 experiments, and the first is with adult participants. Do I need to enter this experiment?
No, please only enter the infant/child experiments
What level of detail should I report?
The sound stimuli differ approx. 6 ms in length, but the experiment is not about length differences. Do I have to report this difference although it is very small?
In case there’s a column for stimulus length, please report it. You are right that this experiment is not about length differences, but having the information cannot hurt, and eventual analyses will reflect that the difference is very small.
The article reports a table with the lengths of each individual stimulus. Should I calculate and report the average value?
Yes, please report the averaged value in the appropriate column.
I am entering an article with the HAS method. The authors report results for both the 2 and 4 minutes after the test phase has started. Your example only reports the results after 2 minutes, but would you still want me to report both?
It is often the case that articles report more than one type of result. Please just report the ones that we also provide in the example file!
Effect Sizes
What are effect sizes?
In MAs (meta-analyses) we express the outcome of a single experiment in a way that captures how big an effect is and how much it varies. There are 3 groups of effect sizes:
1. effect sizes based on means, which includes Cohen’s d on which we focus from here on;
2. effect sizes based on binary data; and
3. effect sizes based on correlations.
Since most developmental studies in the lab use mean responses of two groups or of the same infant in two (or more) conditions, Cohen’s d is the appropriate effect size measure. This chapter 3 and the following ones provide a gentle introduction to effect sizes. Cohen’s d is based on standardized mean differences. To get a feel for Cohen’s d we highly recommend to play with the visualization of RPsychologist. A list of recommended readings is also provided at the end of this document.
In a typical infant study, babies might hear two types of trials and the responses to each are compared. In most papers, it is sufficient that the difference between the trial types reaches statistical significance, but in a meta-analyses we care about the size of this single observed effect and its variance. This allows us to pool over several studies, weigh each datapoint, and arrive at an estimate of the underlying, true effect. This then allows us to calculate power and check how effect sizes might be systematically affected by variables such as infant age in “moderator analyses”.
Recommended further readings for an introduction to effect sizes:
- Textbooks are great to get a basic overview of how to calculate effect sizes. We consulted: Lipsey, M. W. & Wilson, D. B. (2001). Practical meta-analysis. Thousand Oaks, CA: Sage.
- A great primer and a spreadsheet document to calculate effect sizes by hand can be found via: D. Lakens. (2013). Calculating and Reporting Effect Sizes to Facilitate Cumulative Science: A Practical Primer for t-tests and ANOVAs . Frontiers in Psychology 4:863. Materials on OSF
- Since textbooks do not cover every possible question that different meta-analysts may encounter, we turned to articles for more specific questions. We found this article useful for considering the comparability of effect sizes from within- and between-participant designs: Morris, S. B., & DeShon, R. P. (2002). Combining Effect Size Estimates in Meta-Analysis With Repeated Measures and Independent-Groups Designs. Psychological Methods, 7(1), 1805-125. doi: 10.1037//1082-989X.7.1.105
- Borenstein, M., Hedges, L. V. ,Higgins, J. P. T., Rothstein, H. R. (2009). Introduction to Meta-Analysis. John Wiley & Sons. DOI: 10.1002/9780470743386.ch3
How do I calculate Effect Sizes?
We use R to calculate effect sizes. Visit https://github.com/langcog/metalab2/tree/master/scripts for our code. The metafor package also includes functions to compute the observed effect sizes.
We recommend the following for an introduction to effect sizes:
Textbooks are great to get a basic overview of how to calculate effect sizes. We consulted: Lipsey, M. W. & Wilson, D. B. (2001). Practical meta-analysis. Thousand Oaks, CA: Sage.
A great primer and a spreadsheet document to calculate effect sizes by hand can be found via: D. Lakens. (2013). Calculating and Reporting Effect Sizes to Facilitate Cumulative Science: A Practical Primer for t-tests and ANOVAs . Frontiers in Psychology 4:863. Materials on OSF
Since textbooks do not cover every possible question that different meta-analysts may encounter, we turned to articles for more specific questions. We found this article useful for considering the comparability of effect sizes from within- and between-participant designs: Morris, S. B., & DeShon, R. P. (2002). Combining Effect Size Estimates in Meta-Analysis With Repeated Measures and Independent-Groups Designs. Psychological Methods, 7(1), 1805-125. doi: 10.1037//1082-989X.7.1.105
What if I don’t have all the required information?
Two groups of infants are tested and I treat them as two different entries, but the number of included and excluded infants are only reported as a whole over both groups. What do I do?
As the best approximation we can get, please divide the reported number through the number of groups (in your case 2).
The age of infants is reported in weeks, therefore I multiplied it with 7 to convert it into days. I read in your instructions that you have to multiply months with 30.42 to get a proxy for days. So my question is whether I have to multiply with a different number than 7 to get a proxy for days?
No, that’s fine the way you did it!
In some cases you will still need to contact the authors of the study. People probably don’t know you, so think about what in the object would make you open an email from a stranger. Something like “including your paper in a MA” should be motivational. People are busy: they don’t have time to read lengthy email, especially from someone they don’t know, so be as concise as possible. You could still give them more details later if they ask for it. Don’t be shy, authors are likely to be happy to hear that someone is interested in their work and is going to cite them!
How to run a meta-analytic regression ?
Are there some MA specific plots that I should make?
Resources
Interrogating PubMed via a script
Example MAs: InWordDB
Instructions for creating a CAMA (including further resources)
Structure for MA
How should I structure the data for my meta-analysis?
We are hoping that eventually all of your MAs (meta-analyses) will be included in MetaLab, so we ask you to use the MA template (create a copy), and follow the field specifications to ensure compatibility. (Note that right now, winter 2018, these specifications are biased towards language acquisition research. If you work on another topic, we would be thrilled if you helped us expand and adapt MetaLab).
Ideally, you would code all potentially relevant moderator variables (e.g., experimental manipulations) in addition to the core characteristics (columns in red; e.g., number of participants). However, in the interest of time, you can get started with the core characteristics only. Remember once more to give us viewing rights.
What are the relevant variables for a MA, and how many input rows/columns should I make?
One of my papers has a single experiment but involves both Spanish and English speakers who are tested on a native and a nonnative speech sound contrast. Should that count as 4 experiments (2 languages x 2 contrasts)?
How many rows you make depends on how the results are reported. In this case, the authors report the outcome separately for all four groups. Therefore, please enter the four groups separately; each into their own row. You can copy over descriptions of the experiment.
In Experiment 1, there are two age groups. Do I have to report the age for both groups or do I average both groups into one? If I have to report both groups, how do I report this in the input form?
How many rows you make depends on how the results are reported. In this case, the authors report an average outcome over both age groups, since they did not find a significant difference between the two groups. Therefore, please enter only one row and calculate the average age. If the results were reported separately per age group, make a
How do I retrieve studies?
In a typical full MA, you go through the whole list and only then start entering. The procedure is as follows. Go back to your spreadsheet, and for each study that has been decided as a “yes” during screening, try to retrieve the full text for the paper as you normally would (e.g., search through scholar.google.com; regular google; your institution’s library, etc.) If you cannot retrieve it, update your spreadsheet sheet Relevant_studies_search to mark this paper as “no” in column F entitled “Fulltext_retrieved”. If you want, you can contact the authors to try to get the full text from them, in which case you can note this on column G.
If you do find the full text, go through the paper to find the first experiment reported. You will enter all experiments and conditions one at a time, and fill in their information in the MA spreadsheet you created in step 4.
How do I enter and code relevant studies?
IMPORTANT: You should work backwards from the results section: look at what dependent measures are reported fully enough that you will be able to extract an effect size from them.
The following information allows one to calculate an effect size (we are sticking to experimental designs, since most of our MAs are experimental):
between-participant studies:
> Means and SDs (not SEs!) of the dependent variable for each infant group are all that is required for the calculation of Cohen’s d. Sometimes, means and SDs are not available as numbers. If there are clear figures, you can try to estimate means and SDs using this online app or the R package metaDigitise. If you decide to estimate values from figures, add a column to keep track of this. Finally, t or F values for the main effect in combination with sample sizes can be used to calculate Cohen’s d. Note them when available.within-participant studies:
> Effect sizes for this type of study are calculated the same way as in between-participant studies, but in order to calculate the weight of these studies the correlation between the first and second measurements is required (to account for the amount of within-participant variation). Since this measure is usually not reported, we provide below median and range for correlations found in existing MAs.Infant word segmentation from native speech: 0.641 (range: 0.140 to 0.921)
Infant vowel discrimination (native and nonnative): 0.496 (range: -0.413 to 0.855)
When entering papers, please remember a key thing: all analyses are done by machines, and machines cannot read text! So if a column is “numeric”, please do not enter things that aren’t numbers (such as text, spaces, ~, etc). This is particularly important for the dependent measures!
At this stage, you might find that a given paper does not contain the right information for being included. In this case, you can and should exclude it. If you have already started entering it, you can leave the information you entered and put in “comments” that the entry is incomplete (although if you followed our advice above, you won’t have wasted time entering it!). Remember to update your spreadsheet with each paper you read and made a decision on.
The article I enter has 3 experiments, and the first is with adult participants. Do I need to enter this experiment?
No, please only enter the infant/child experiments
What level of detail should I report?
The sound stimuli differ approx. 6 ms in length, but the experiment is not about length differences. Do I have to report this difference although it is very small?
In case there’s a column for stimulus length, please report it. You are right that this experiment is not about length differences, but having the information cannot hurt, and eventual analyses will reflect that the difference is very small.
The article reports a table with the lengths of each individual stimulus. Should I calculate and report the average value?
Yes, please report the averaged value in the appropriate column.
I am entering an article with the HAS method. The authors report results for both the 2 and 4 minutes after the test phase has started. Your example only reports the results after 2 minutes, but would you still want me to report both?
It is often the case that articles report more than one type of result. Please just report the ones that we also provide in the example file!