Design Choice Analyses
Introduction
The research question determines many design choices in developmental research – e.g., is the hypothesis related to the timecourse of various pressures, or merely the presence of a bias? Some methods are better suited than others for answering these different questions. But, design choices can also influence the size of the effect: Some methods are less noisy than others, and therefore result in larger effects sizes. The size of the effect may further depend on the particular age of the child in a study, with some methods better suited to different age groups. Here we look across datasets in Metalab at four design choices – method, response mode, depenedent measure, and experimental design – and their relationship to effect sizes, and other variables of interest.
This report includes effect sizes for participants 60 months or younger.
Data available for each design choice variable
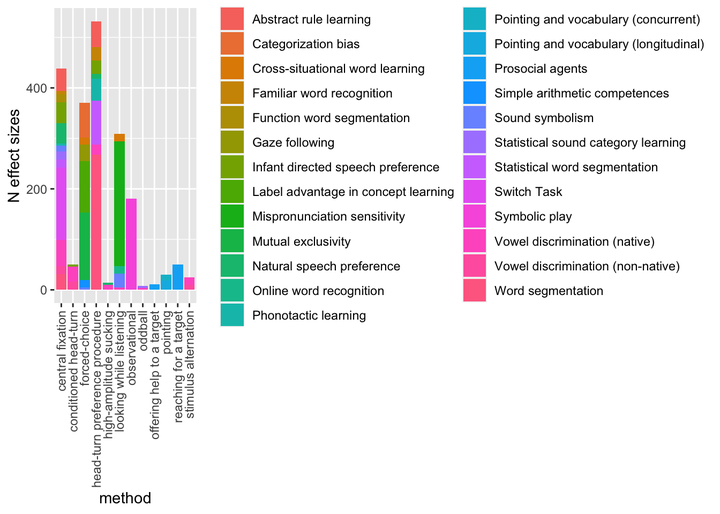
Method
metalab_data <- metalab_data %>%
            filter(mean_age_months <= 60)

metalab_data$method = as.factor(metalab_data$method)
method.pd = metalab_data %>%
  group_by(method, dataset) %>%
  filter(n() > 3) %>%
  summarise(n = n())

ggplot(method.pd, aes(y = n, fill = dataset, x = method)) +
         geom_bar(stat = "identity") +
         xlab("method") +
         ylab("N effect sizes") +
         theme(axis.text.x = element_text(angle = 90, hjust = 1, vjust = .5)) +
        guides(fill=guide_legend(ncol=2))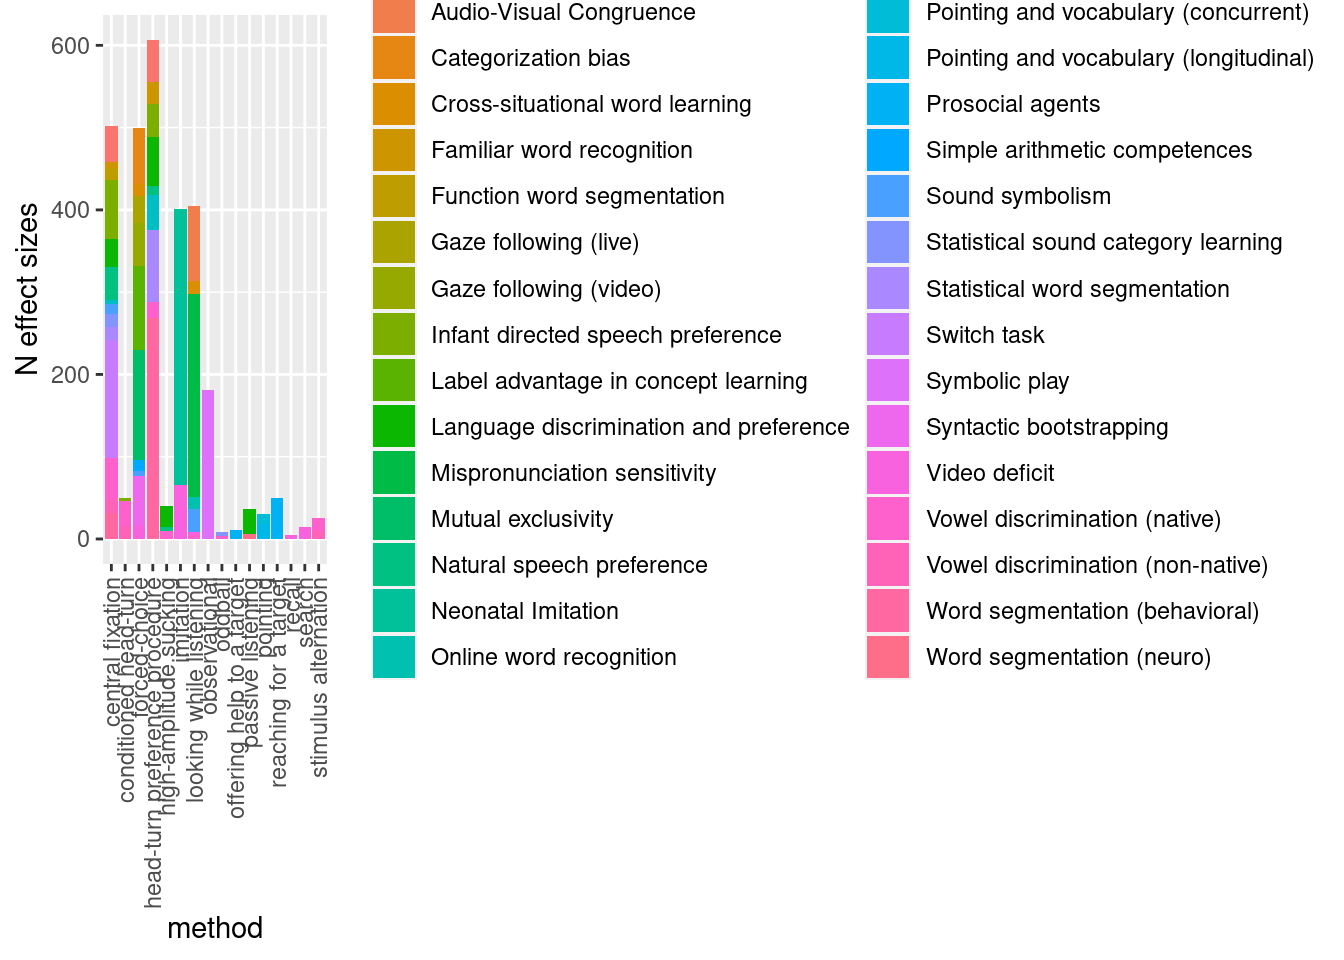
Response Mode
metalab_data$response_mode = as.factor(metalab_data$response_mode)

response.pd = metalab_data %>%
  group_by(response_mode, dataset) %>%
  summarise(n = n())

ggplot(response.pd, aes(y = n, fill = dataset, x = response_mode)) +
         geom_bar(stat = "identity") +
         xlab("response mode") +
         ylab("N effect sizes") +
  theme (axis.text.x = element_text(angle = 90, hjust = 1, vjust = .5)) +
        guides(fill=guide_legend(ncol=2))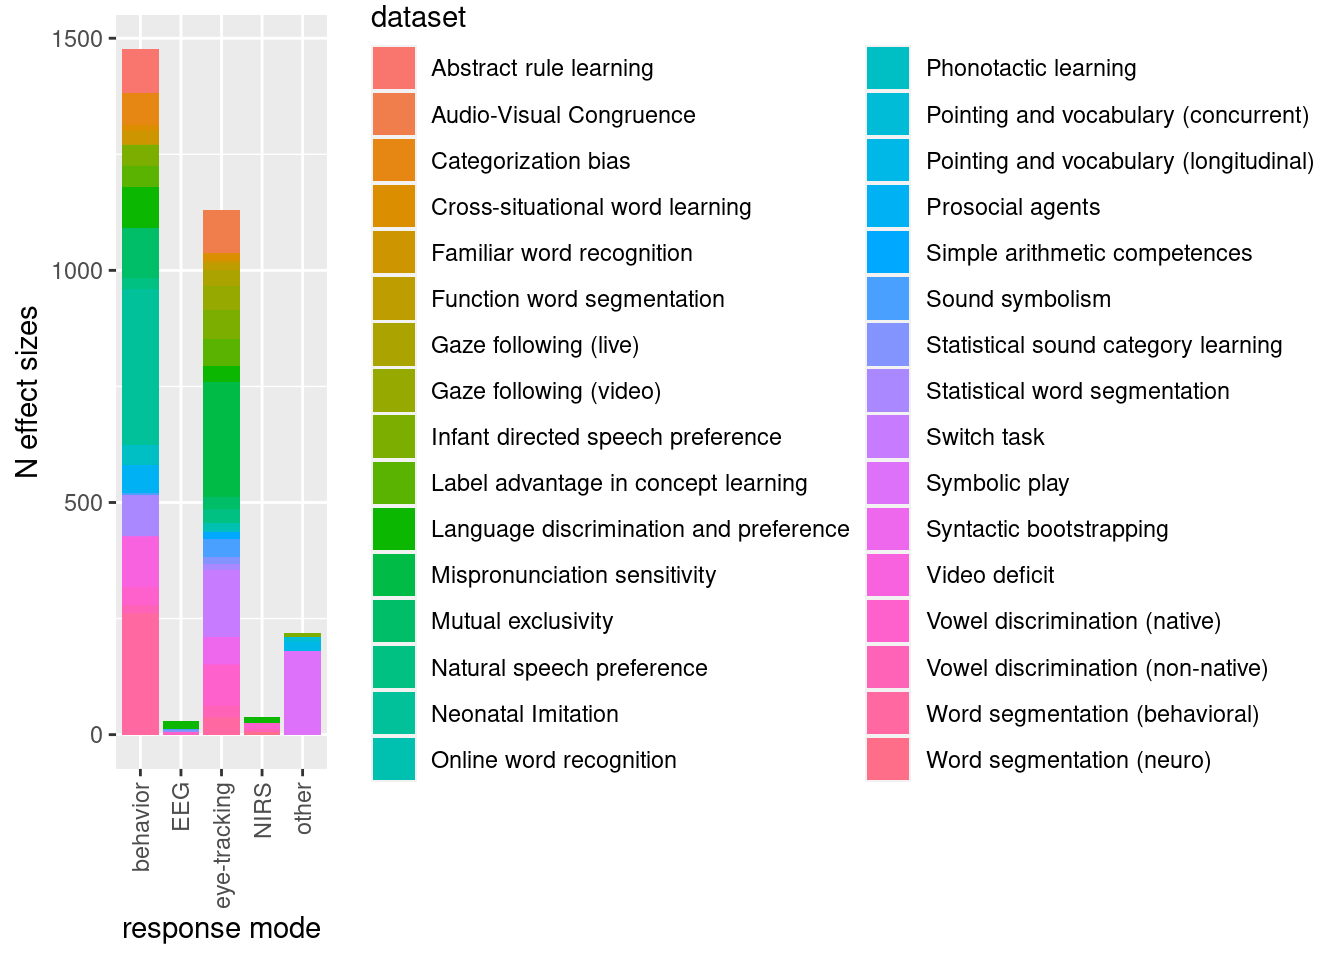
Dependent Measure
metalab_data$dependent_measure= as.factor(metalab_data$dependent_measure)
dm.pd = metalab_data %>%
  group_by(dependent_measure, dataset) %>%
  summarise(n = n())

ggplot(dm.pd, aes(y = n, fill = dataset, x = dependent_measure)) +
         geom_bar(stat = "identity") +
         xlab("method") +
         ylab("N effect sizes") +
         theme (axis.text.x = element_text(angle = 90, hjust = 1, vjust = .5)) +
        guides(fill=guide_legend(ncol=2))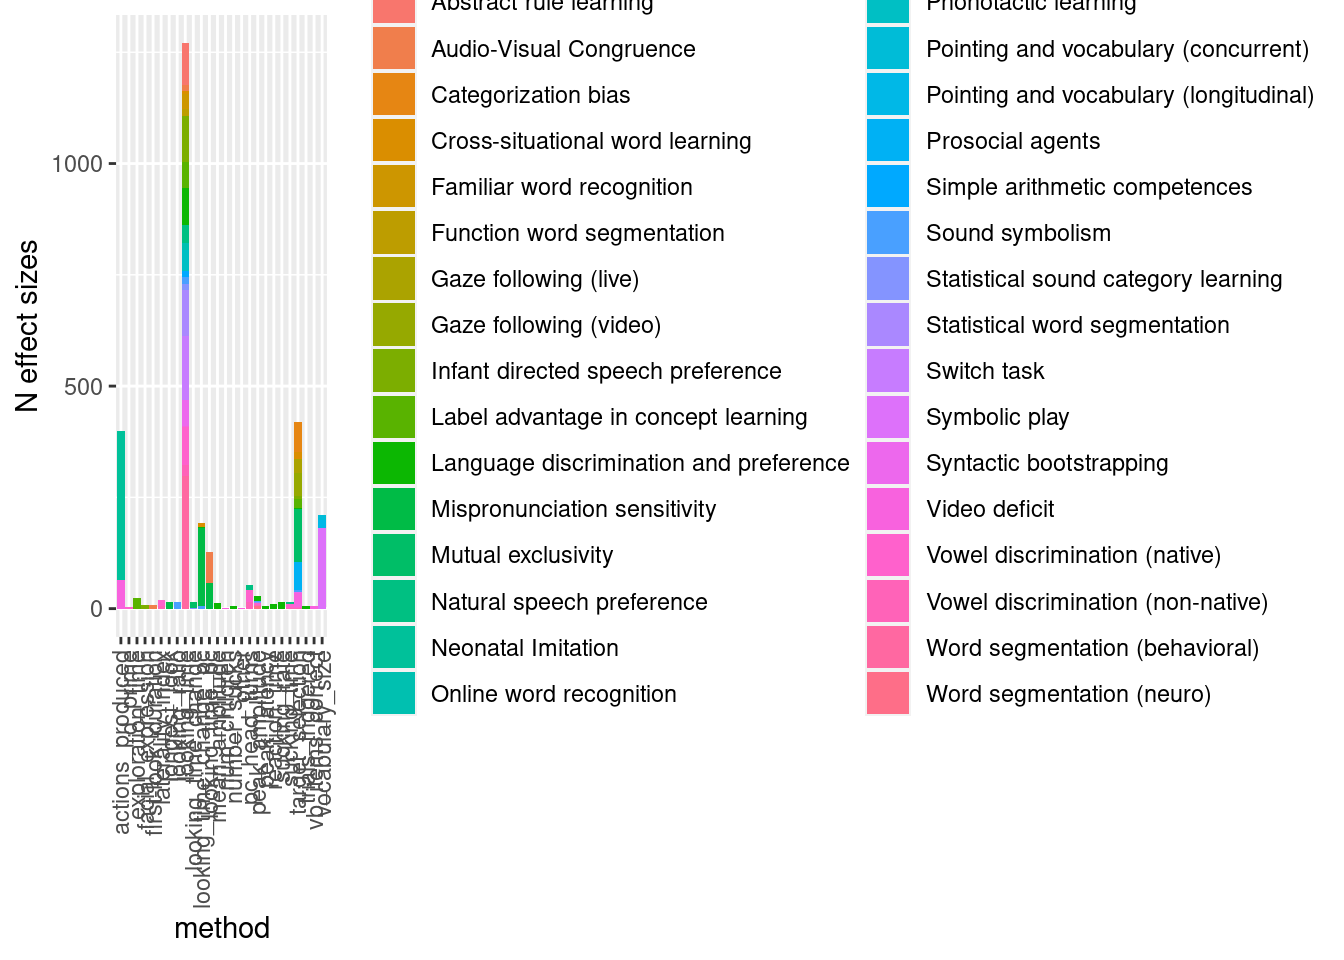
Participant design
metalab_data$participant_design = as.factor(metalab_data$participant_design)
participant_design.pd = metalab_data %>%
  group_by(participant_design, dataset) %>%
  summarise(n = n())

ggplot(participant_design.pd, aes(y = n, fill = dataset, x = participant_design)) +
         geom_bar(stat = "identity") +
         xlab("participant design") +
         ylab("N effect sizes") +
      theme (axis.text.x = element_text(angle = 90, hjust = 1, vjust = .5)) +
        guides(fill=guide_legend(ncol=2))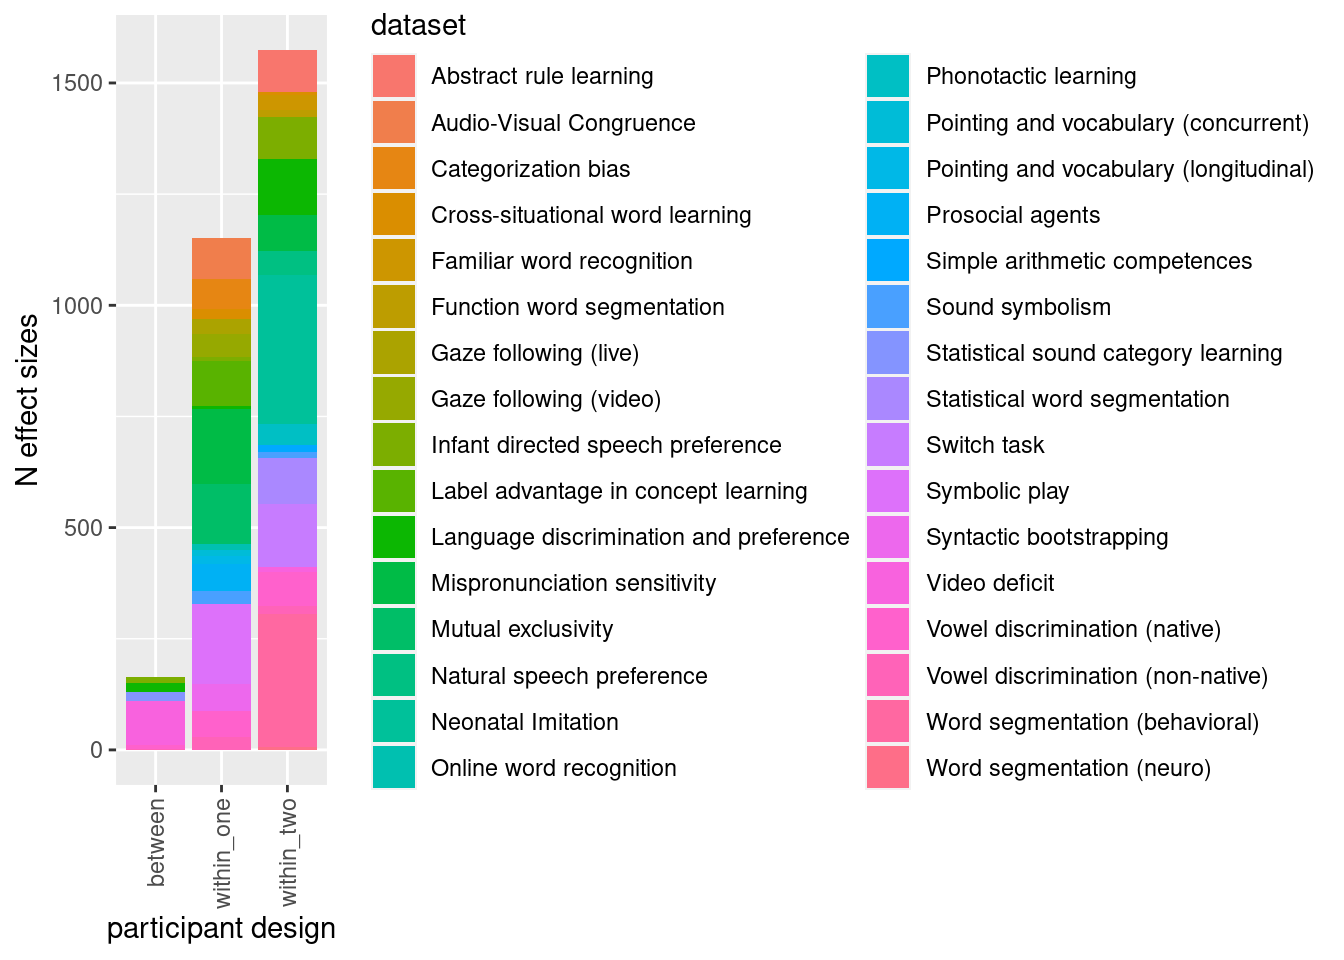
Design choice variables by age
age.response_mode.pd = metalab_data %>%
  mutate(mean_age_months_rounded = cut_width(mean_age_months,  width = 3, boundary = 0))  %>%
  group_by(mean_age_months_rounded, response_mode) %>%
  summarise(n = n()) %>%
  mutate(prop = n / sum(n))

ggplot(age.response_mode.pd, aes(x = mean_age_months_rounded, y = prop, color = response_mode)) +
  geom_point() +
  geom_line(aes(group = response_mode)) +
    xlab("Age (months)") +
  theme (axis.text.x = element_text(angle = 90, hjust = 1, vjust = .5)) +
  ggtitle("Response Mode")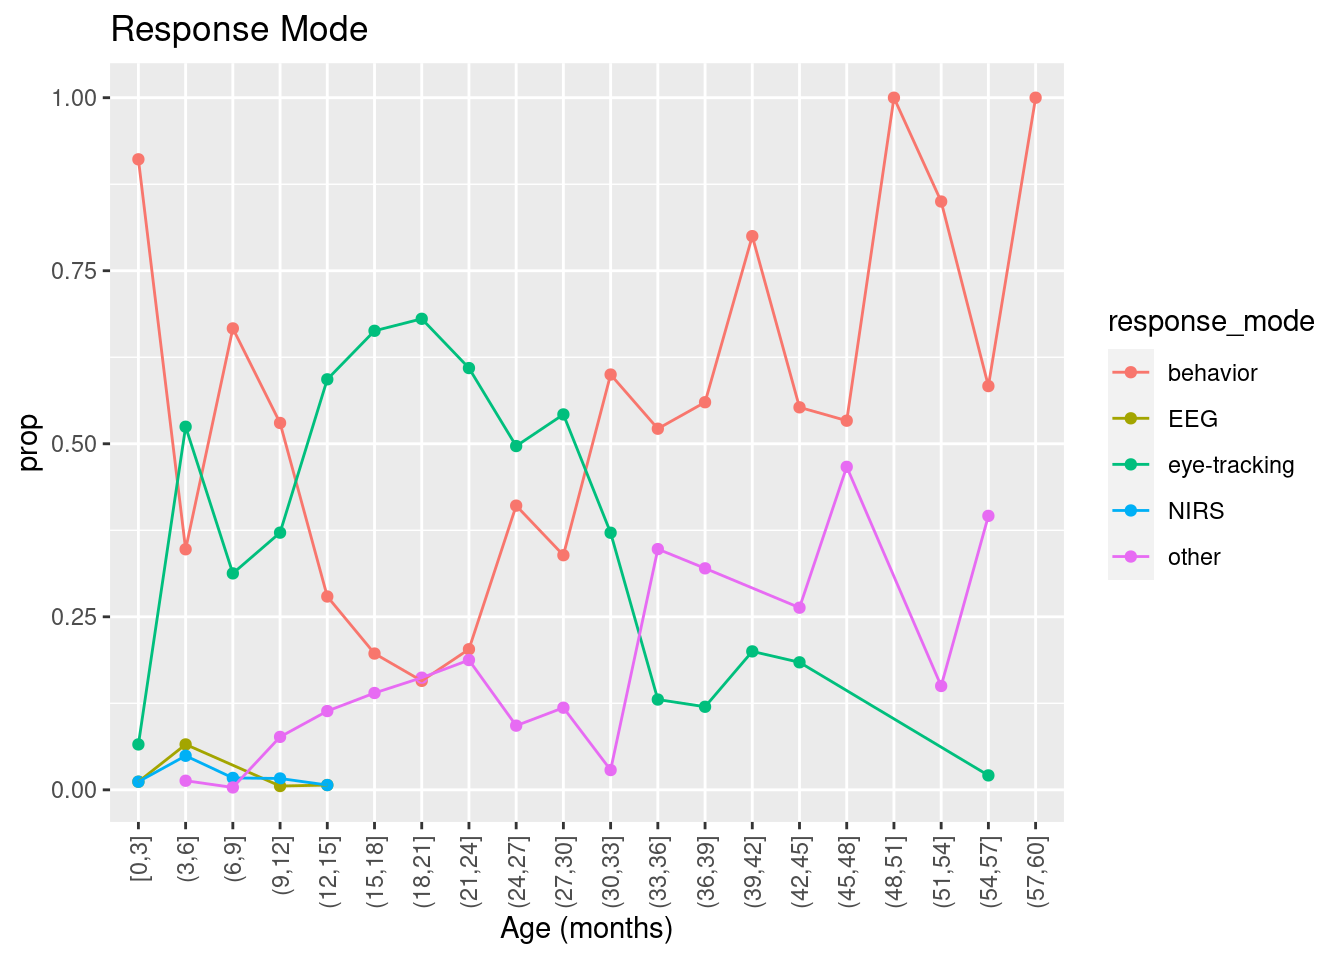
ggplot(age.response_mode.pd, aes(x = mean_age_months_rounded, y = n, color = response_mode)) +
  geom_point() +
  geom_line(aes(group = response_mode)) +
    xlab("Age (months)") +
  theme (axis.text.x = element_text(angle = 90, hjust = 1, vjust = .5)) +
  ggtitle("Response Mode")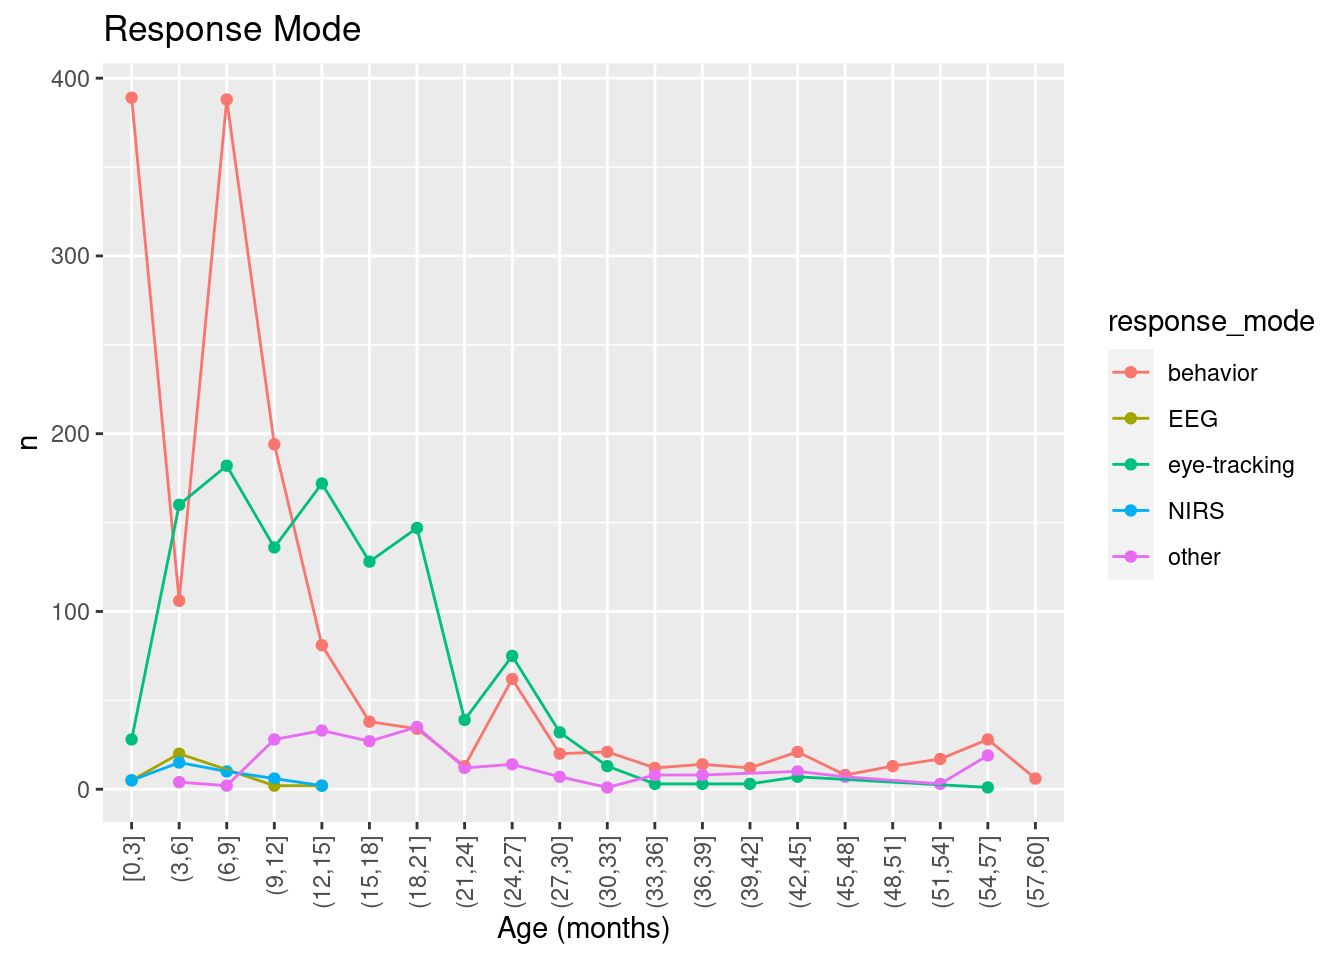
age.method.pd = metalab_data %>%
  mutate(mean_age_months_rounded = cut_width(mean_age_months,  width = 3, boundary = 0))  %>%
  group_by(mean_age_months_rounded, method) %>%
  summarise(n = n()) %>%
  mutate(prop = n / sum(n))

ggplot(age.method.pd, aes(x = mean_age_months_rounded, y = prop, color = method)) +
  geom_point() +
  geom_line(aes(group = method)) +
    xlab("Age (months)") +
  theme (axis.text.x = element_text(angle = 90, hjust = 1, vjust = .5)) +
  ggtitle("Method")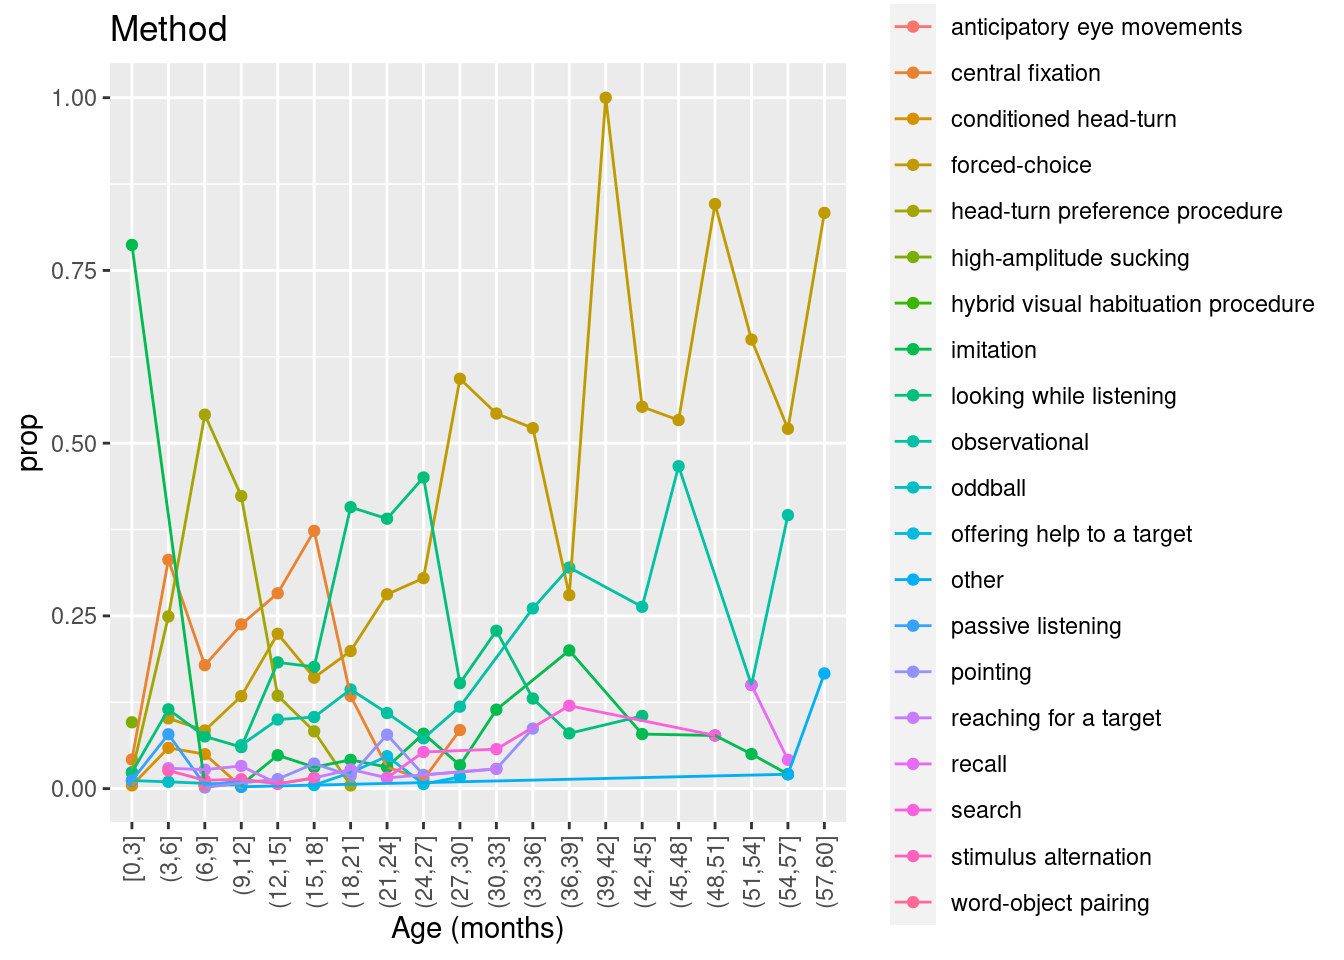
ggplot(age.method.pd, aes(x = mean_age_months_rounded, y = n, color = method)) +
  geom_point() +
  geom_line(aes(group = method)) +
    xlab("Age (months)") +
  theme (axis.text.x = element_text(angle = 90, hjust = 1, vjust = .5)) +
  ggtitle("Method")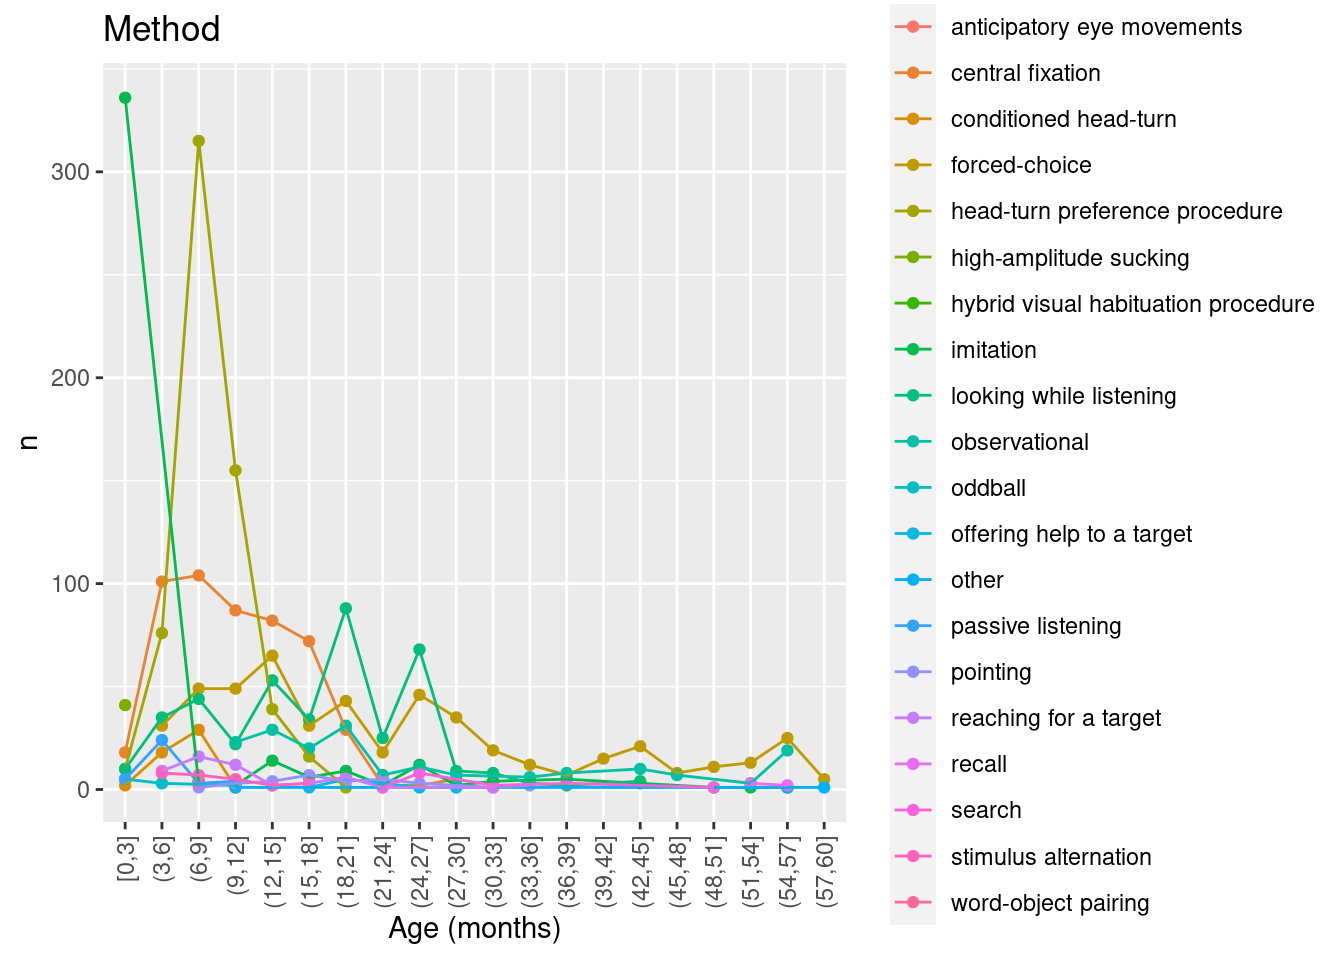
age.dm.pd = metalab_data %>%
  mutate(mean_age_months_rounded = cut_width(mean_age_months,  width = 3, boundary = 0))  %>%
  group_by(mean_age_months_rounded, dependent_measure) %>%
  summarise(n = n()) %>%
  mutate(prop = n / sum(n))

ggplot(age.dm.pd, aes(x = mean_age_months_rounded, y = prop, color = dependent_measure)) +
  geom_point() +
  geom_line(aes(group = dependent_measure)) +
    xlab("Age (months)") +
  theme (axis.text.x = element_text(angle = 90, hjust = 1, vjust = .5)) +
  ggtitle("Dependent Measure")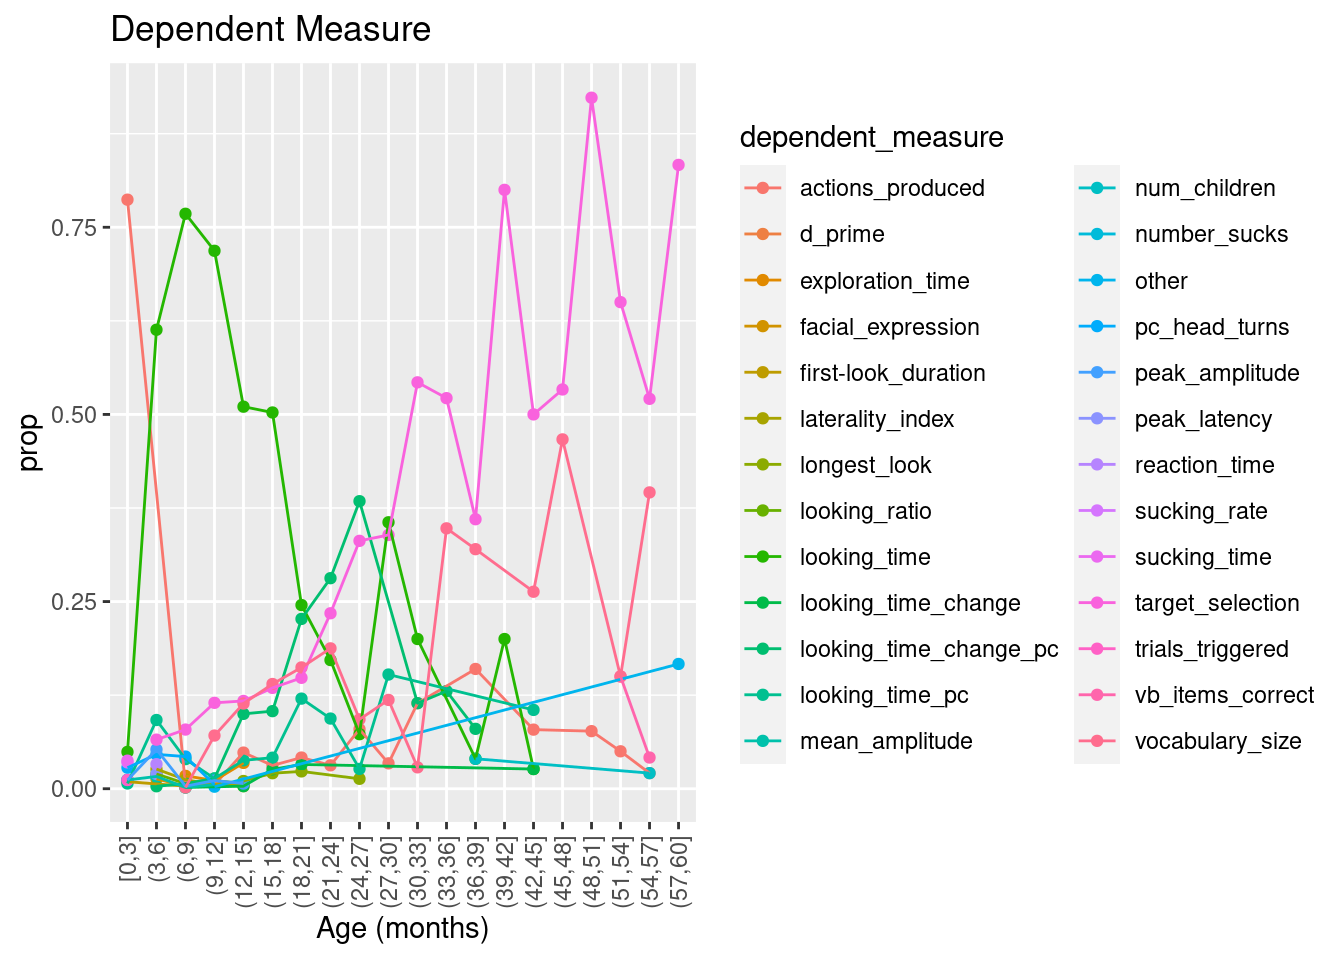
ggplot(age.dm.pd, aes(x = mean_age_months_rounded, y = n, color = dependent_measure)) +
  geom_point() +
  geom_line(aes(group = dependent_measure)) +
    xlab("Age (months)") +
  theme (axis.text.x = element_text(angle = 90, hjust = 1, vjust = .5)) +
  ggtitle("Dependent Measure")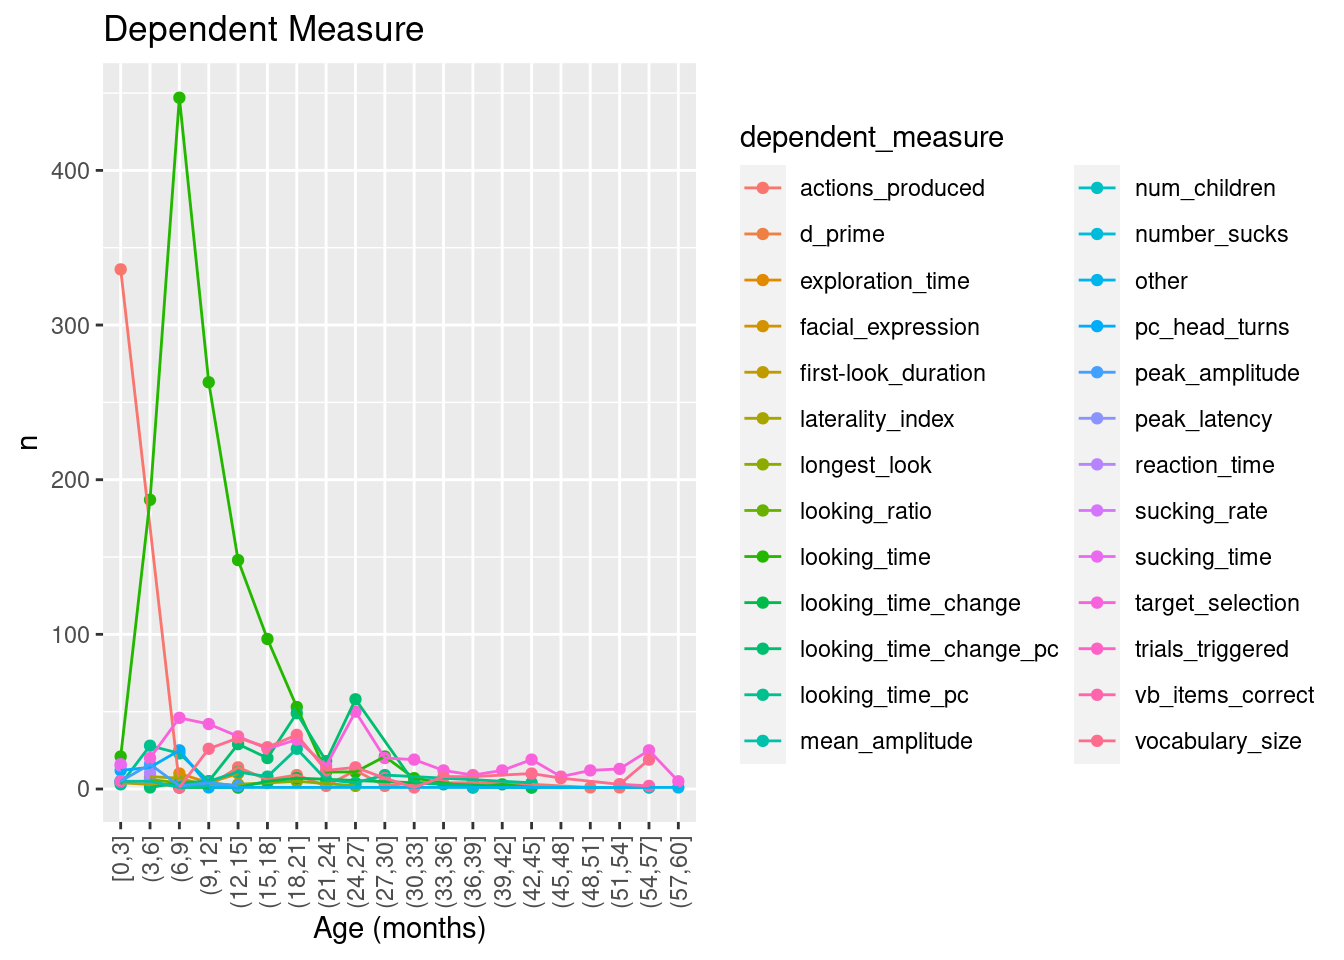
age.pd.pd = metalab_data %>%
  mutate(mean_age_months_rounded = cut_width(mean_age_months,  width = 3, boundary = 0))  %>%
  group_by(mean_age_months_rounded, participant_design) %>%
  summarise(n = n()) %>%
  mutate(prop = n / sum(n))

ggplot(age.pd.pd, aes(x = mean_age_months_rounded, y = prop, color = participant_design)) +
  geom_point() +
  geom_line(aes(group = participant_design)) +
  xlab("Age (months)") +
  theme (axis.text.x = element_text(angle = 90, hjust = 1, vjust = .5)) +
  ggtitle("Participant Design")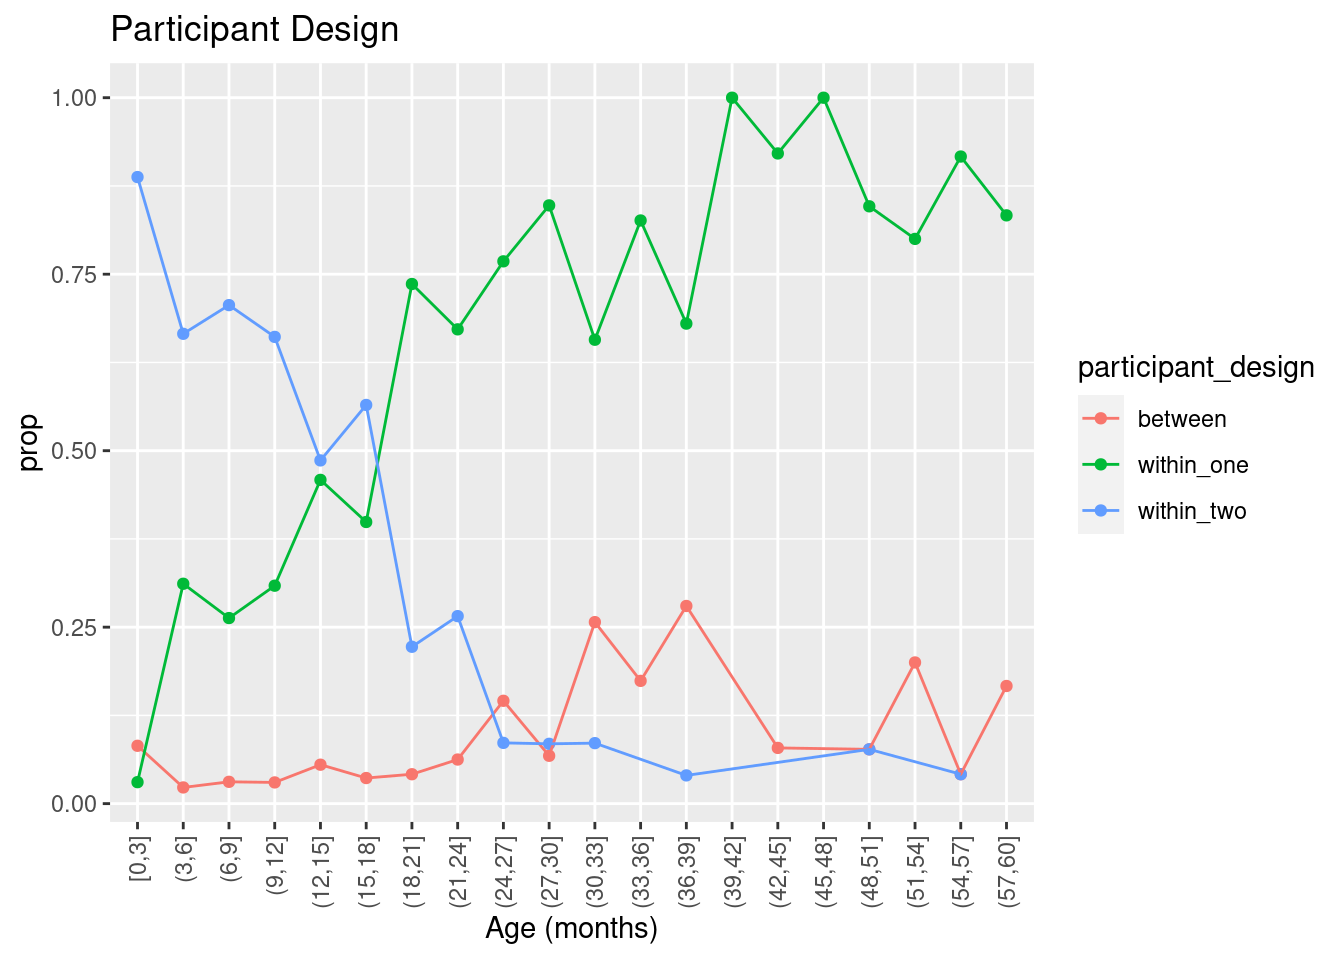
ggplot(age.pd.pd, aes(x = mean_age_months_rounded, y = n, color = participant_design)) +
  geom_point() +
  geom_line(aes(group = participant_design)) +
    xlab("Age (months)") +
  theme (axis.text.x = element_text(angle = 90, hjust = 1, vjust = .5)) +
  ggtitle("Participant Design")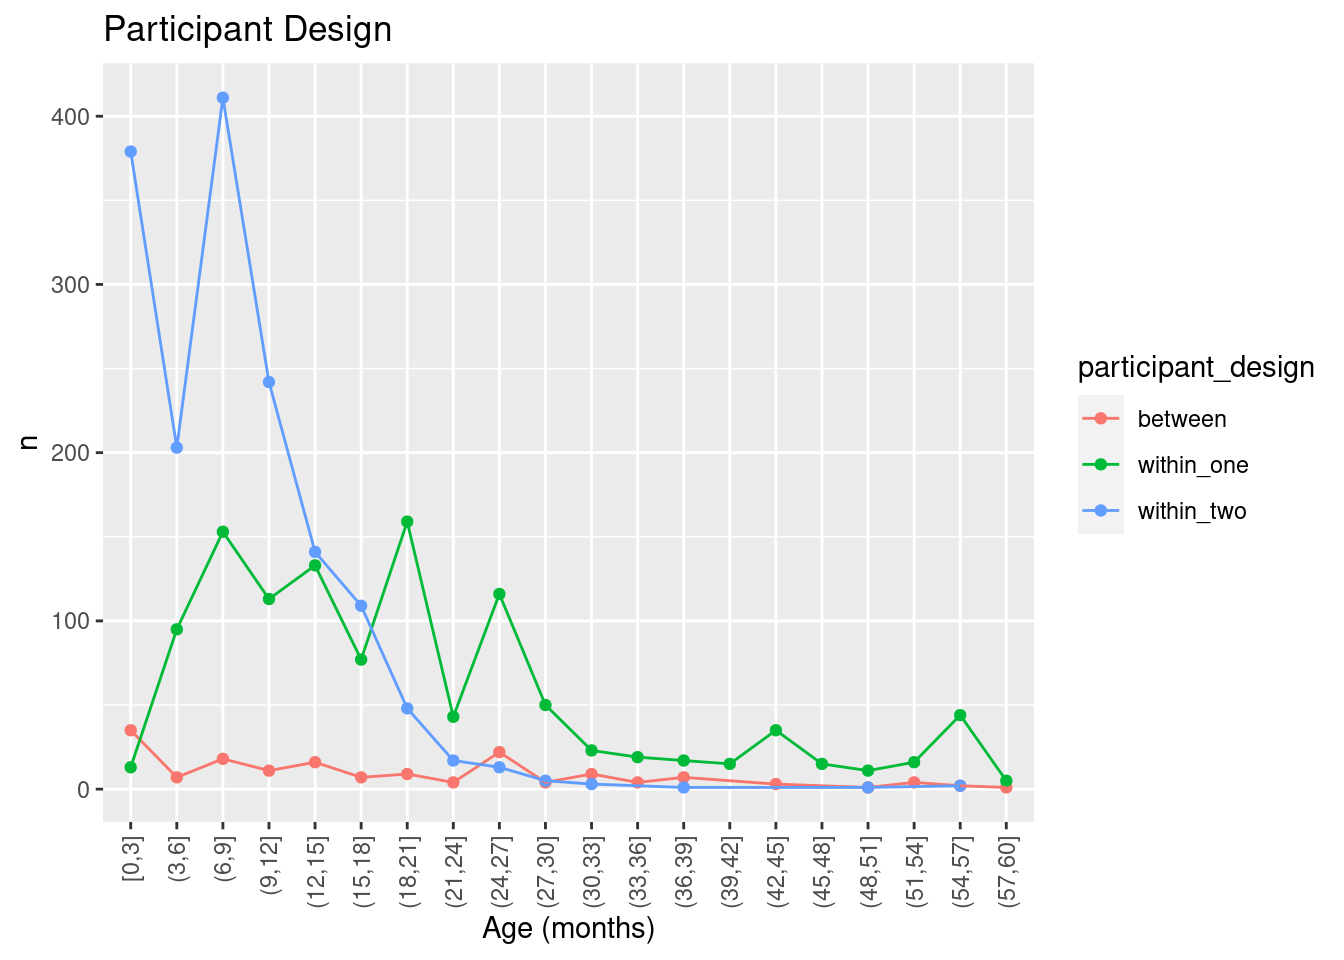
Effect size by design choice variables
By dataset
Get residual effect size, controling for age and phenonmenon
full.model = rma(d_calc ~ dataset + mean_age_1,
        vi = d_var_calc, data = metalab_data, method = "REML")

residuals = rstandard(full.model)

metalab_data = metalab_data %>%
            bind_cols(as.data.frame(residuals$resid),
                      as.data.frame(residuals$z)) %>%
            rename(residual.d = `residuals$resid`,
                   residual.d.s = `residuals$z`) # standardized
method.pd = metalab_data %>%
group_by(method, dataset) %>%
summarise(residual.d = mean(residual.d),
n = n())
ggplot(method.pd, aes(x = method, y = residual.d, color = dataset)) +
geom_point(aes(size = n)) +
geom_line(aes(group = dataset)) +
theme (axis.text.x = element_text(angle = 90, hjust = 1, vjust = .5)) +
ggtitle("Method") +
guides(colour=guide_legend(ncol=2))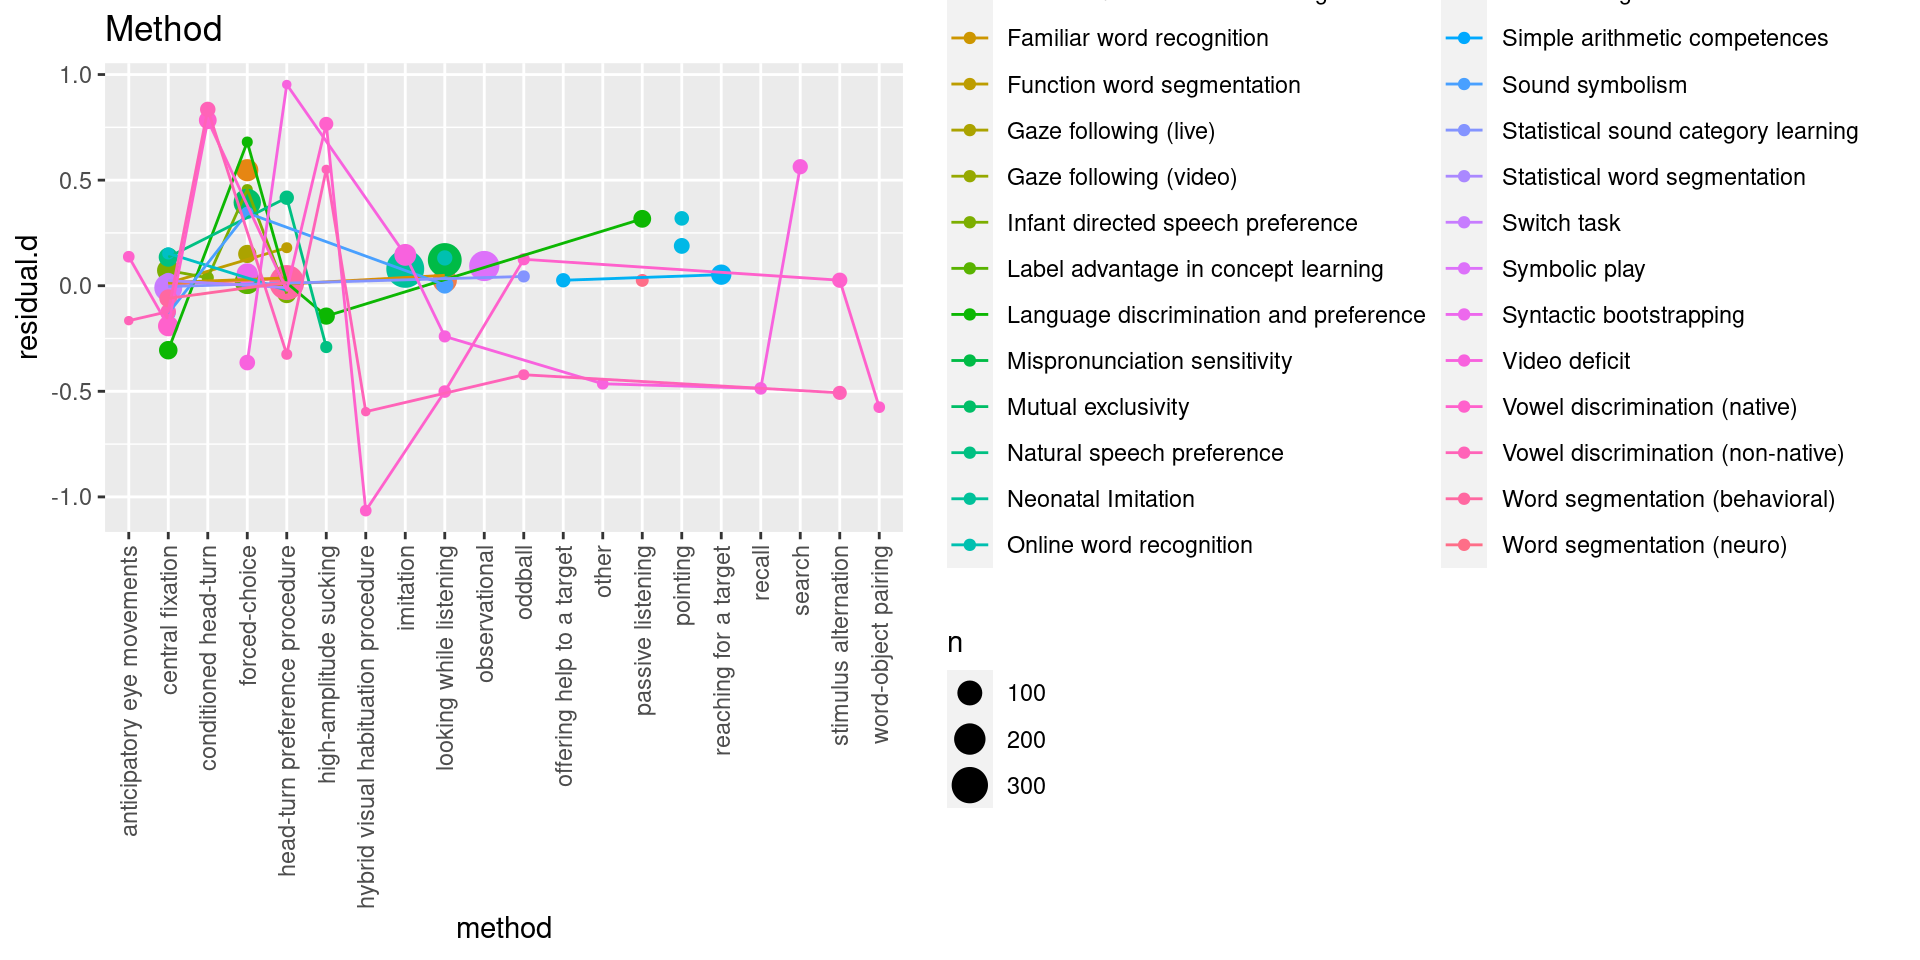
response.pd = metalab_data %>%
  group_by(response_mode, dataset) %>%
  summarise(residual.d = mean(residual.d),
            n = n())

ggplot(response.pd, aes(x = response_mode, y = residual.d, color = dataset)) +
  geom_point(aes(size = n)) +
  geom_line(aes(group = dataset)) +
  theme (axis.text.x = element_text(angle = 90, hjust = 1, vjust = .5)) +
  ggtitle("Response Mode") +
  guides(colour=guide_legend(ncol=2))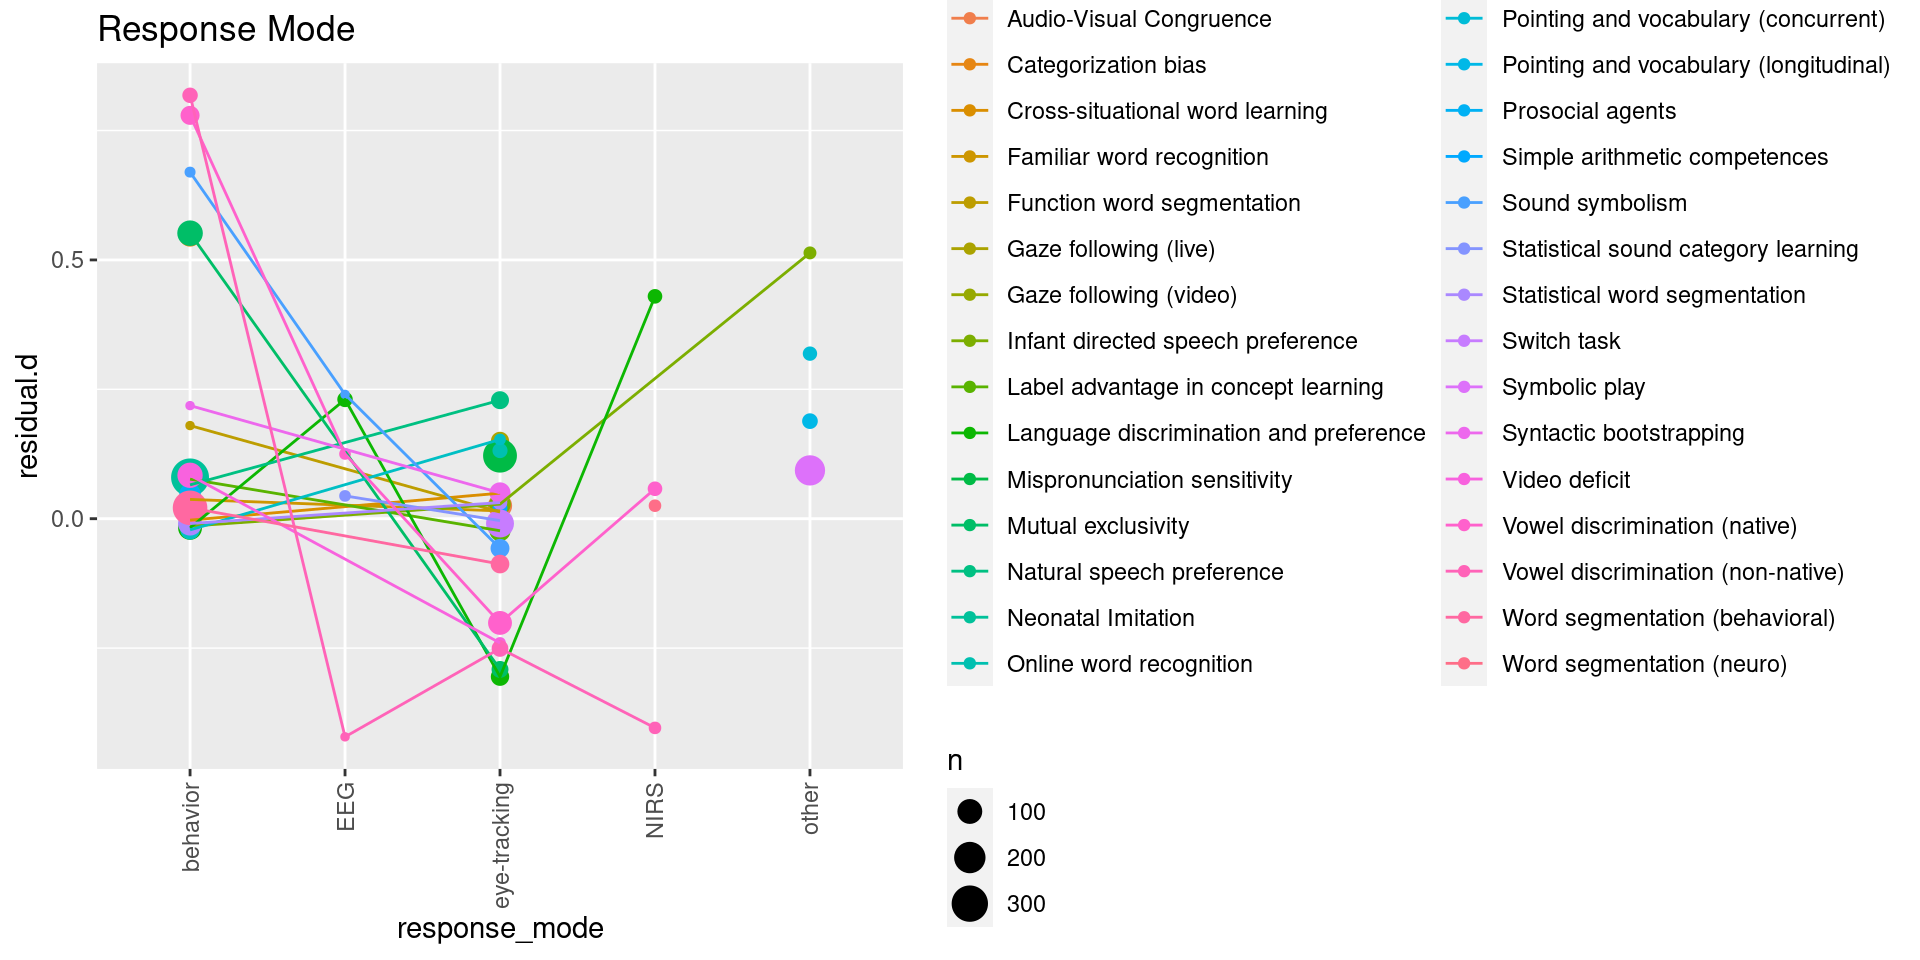
dm.pd = metalab_data %>%
  group_by(dependent_measure, dataset) %>%
  summarise(residual.d = mean(residual.d),
            n = n())

ggplot(dm.pd, aes(x = dependent_measure, y = residual.d, color = dataset)) +
  geom_point(aes(size = n)) +
  geom_line(aes(group = dataset)) +
  theme (axis.text.x = element_text(angle = 90, hjust = 1, vjust = .5)) +
  ggtitle("Dependent Measure") +
  guides(colour=guide_legend(ncol=2))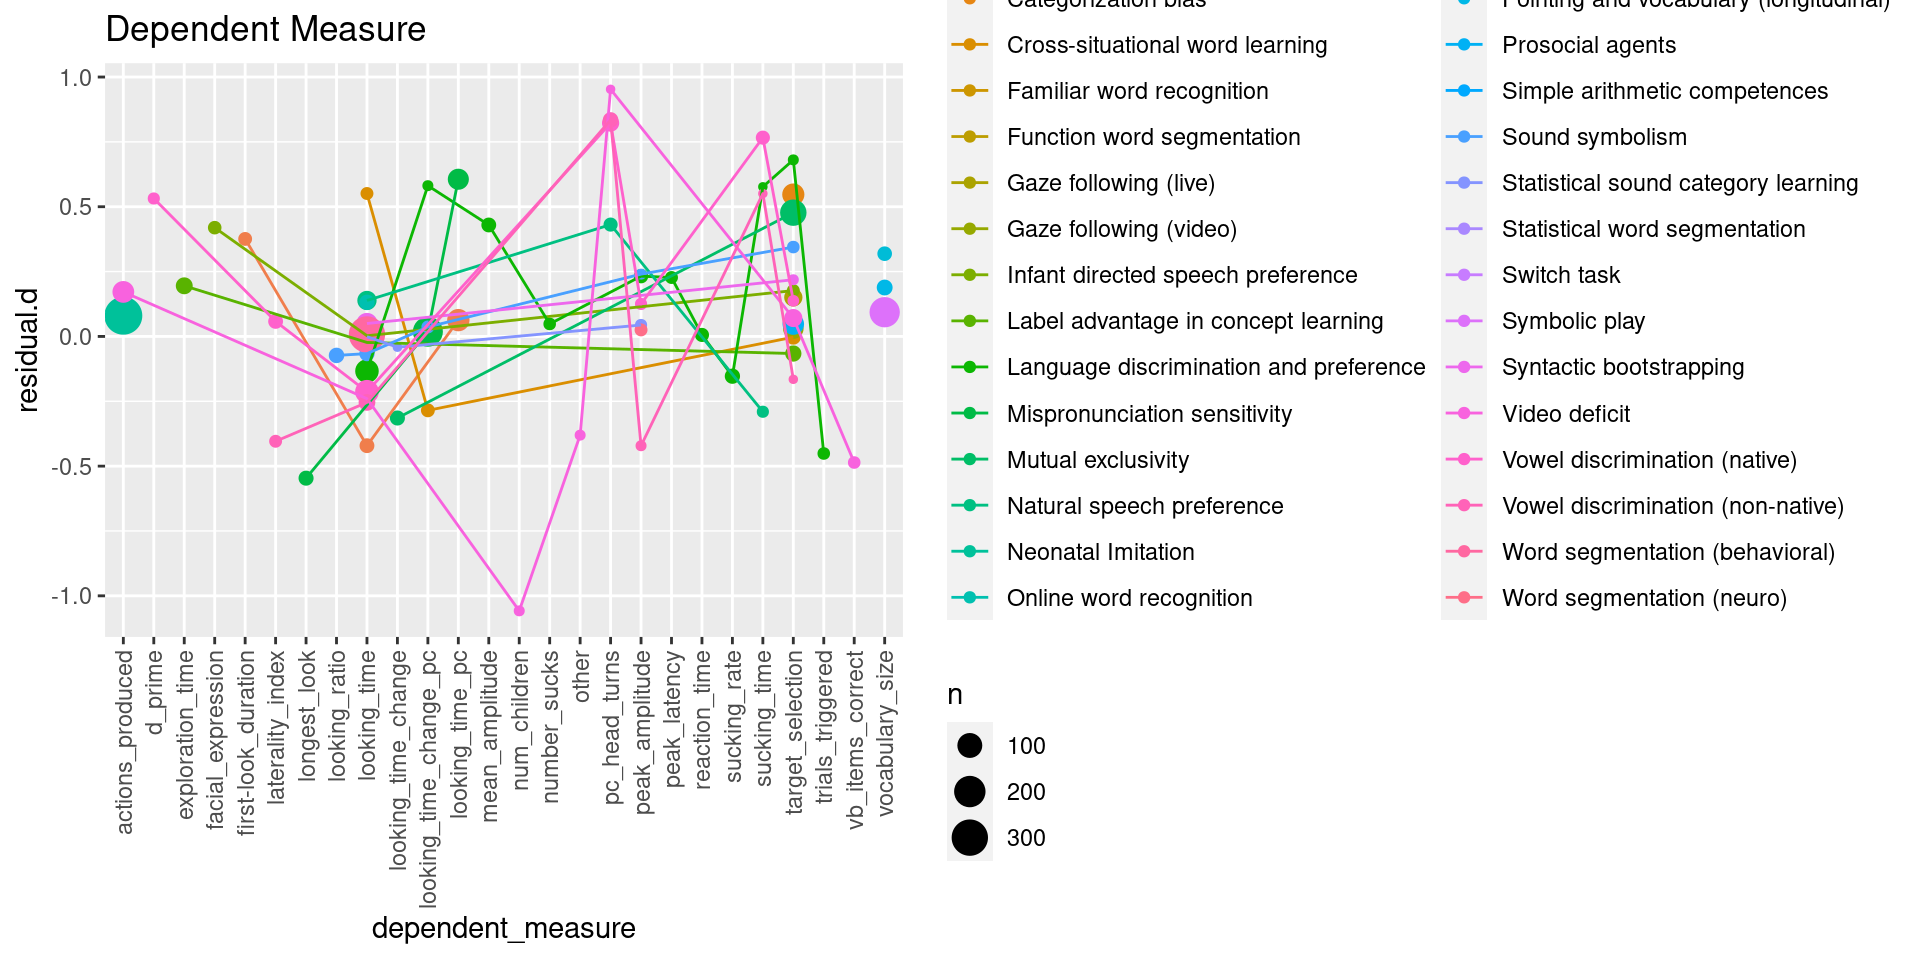
participant_design.pd = metalab_data %>%
  group_by(participant_design, dataset) %>%
  summarise(residual.d = mean(residual.d),
            n = n())

ggplot(participant_design.pd, aes(x = participant_design, y = residual.d, color = dataset)) +
  geom_point(aes(size = n)) +
  geom_line(aes(group = dataset)) +
  theme (axis.text.x = element_text(angle = 90, hjust = 1, vjust = .5)) +
  ggtitle("Participant Design") +
  guides(colour=guide_legend(ncol=2))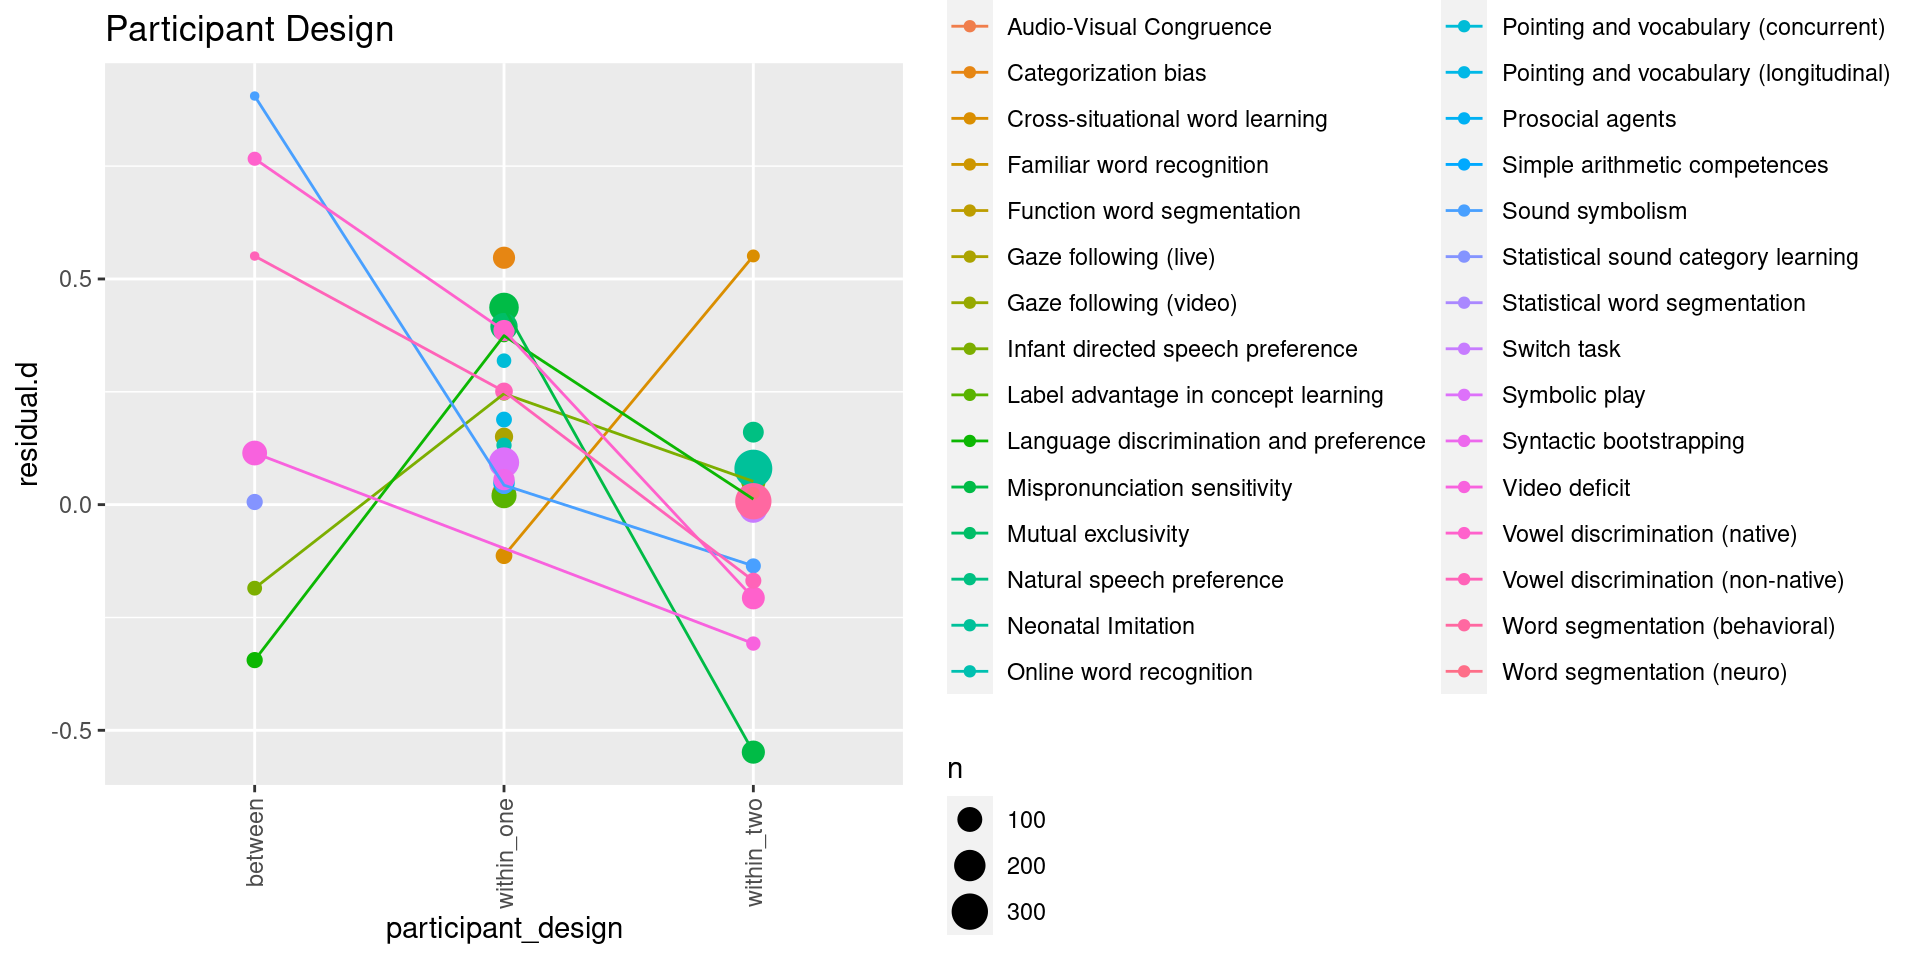
Across datasets
method.pd.all = metalab_data %>%
  group_by(method) %>%
  multi_boot_standard(col = "residual.d") %>%
  ungroup() %>%
  mutate(method = reorder(method, mean))

ggplot(method.pd.all, aes(x = method, y = mean, fill = method)) +
  geom_bar(position="dodge", stat="identity") +
  geom_errorbar(aes(ymin = ci_lower, ymax= ci_upper),
                width=0.2, position="dodge") +
  ylab("residual effect size") +
  xlab("method") +
  theme(legend.position="none") +
theme(axis.text.x = element_text(angle = 90, hjust = 1, vjust = .5)) 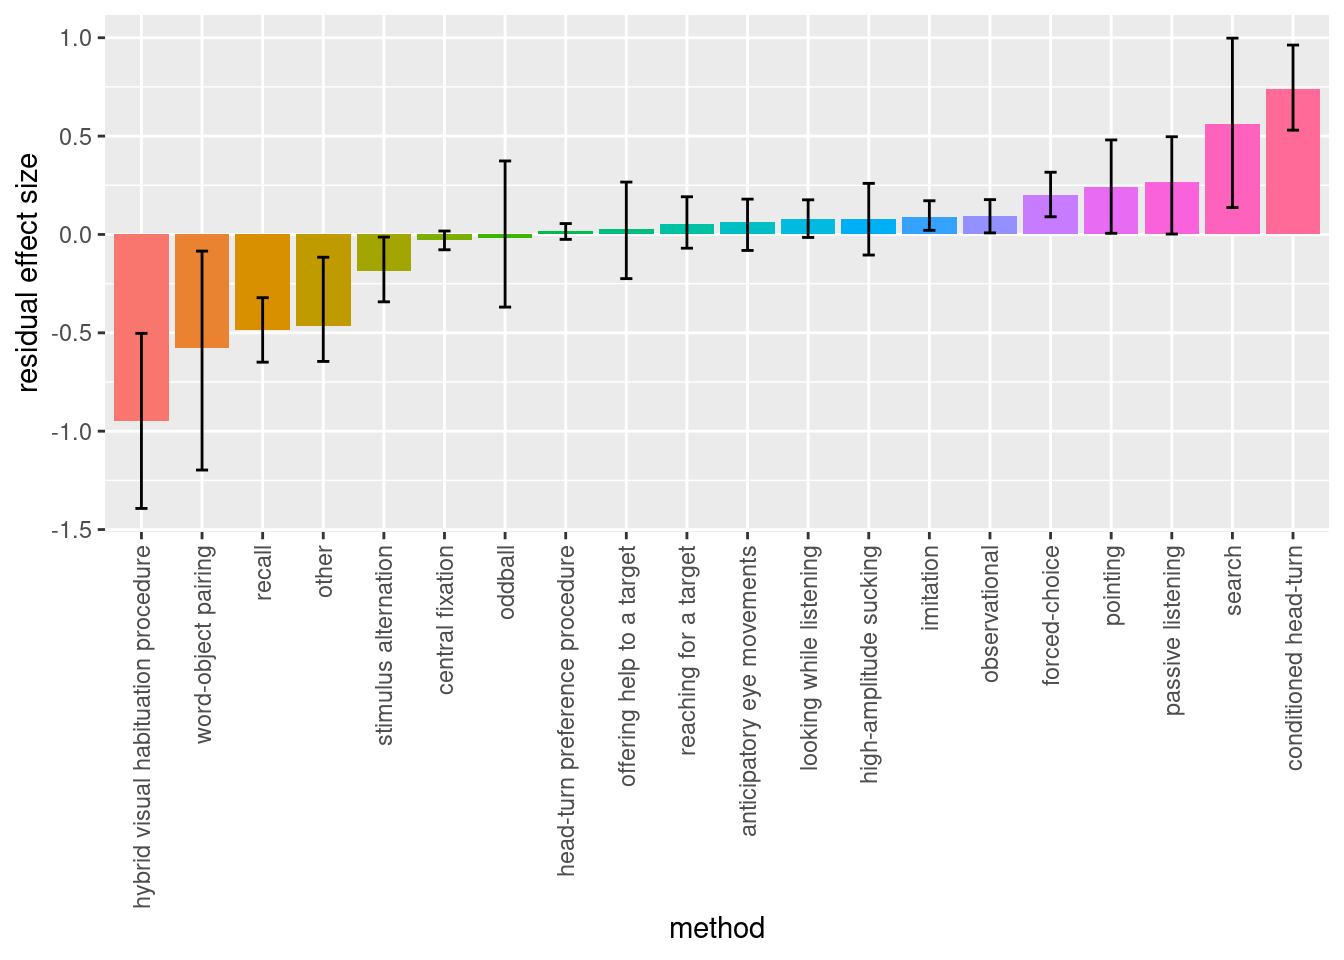
response.pd.all = metalab_data %>%
  group_by(response_mode) %>%
  multi_boot_standard(col = "residual.d") %>%
  ungroup() %>%
  mutate(response_mode = reorder(response_mode, mean))

ggplot(response.pd.all, aes(x = response_mode, y = mean, fill = response_mode)) +
  geom_bar(position="dodge", stat="identity") +
  geom_errorbar(aes(ymin = ci_lower, ymax= ci_upper),
                width=0.2, position="dodge") +
  ylab("residual effect size") +
  xlab("response mode") +
  theme(legend.position = "none") +
theme(axis.text.x = element_text(angle = 90, hjust = 1, vjust = .5)) 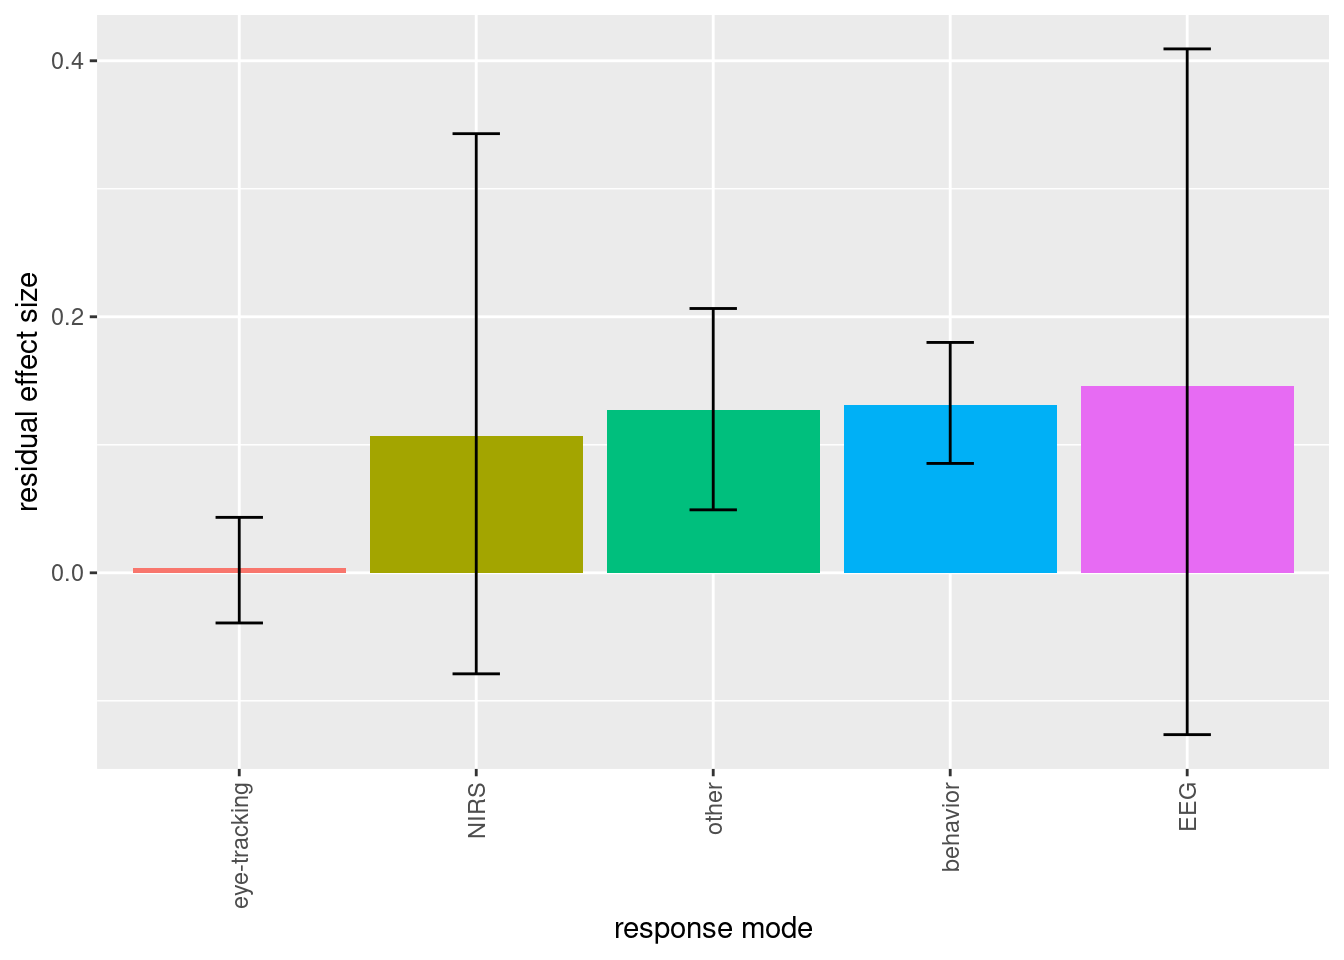
dm.pd.all = metalab_data %>%
  group_by(dependent_measure) %>%
  multi_boot_standard(col = "residual.d") %>%
    ungroup() %>%
  mutate(dependent_measure = reorder(dependent_measure, mean))

ggplot(dm.pd.all, aes(x =dependent_measure, y = mean, fill = dependent_measure)) +
  geom_bar(position="dodge", stat="identity") +
  geom_errorbar(aes(ymin = ci_lower, ymax= ci_upper),
                width=0.2, position="dodge") +
  ylab("residual effect size") +
  xlab("dependent measure") +
  theme(legend.position="none") +
theme (axis.text.x = element_text(angle = 90, hjust = 1, vjust = .5)) 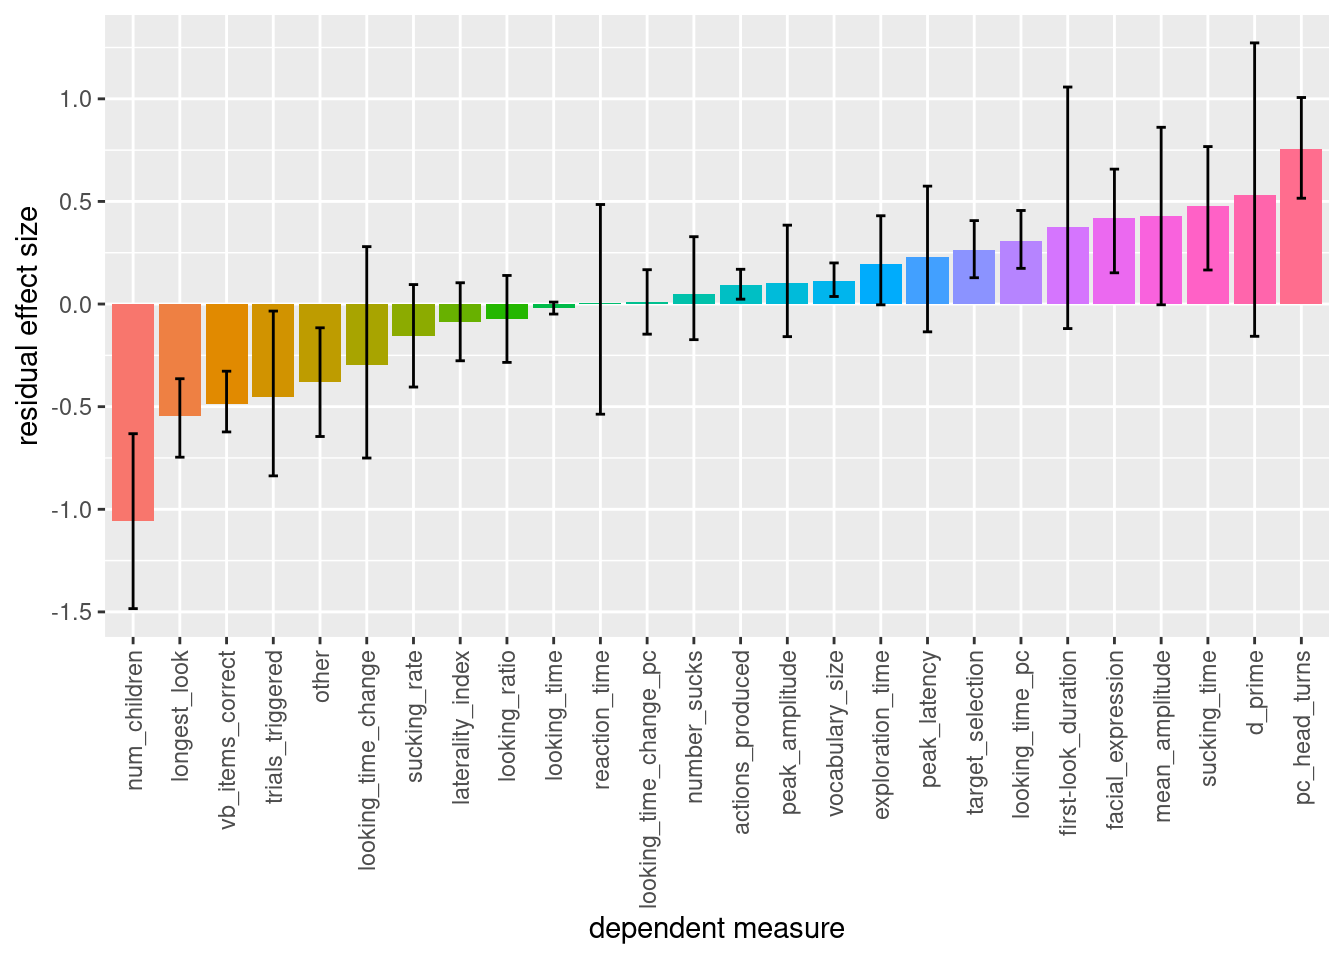
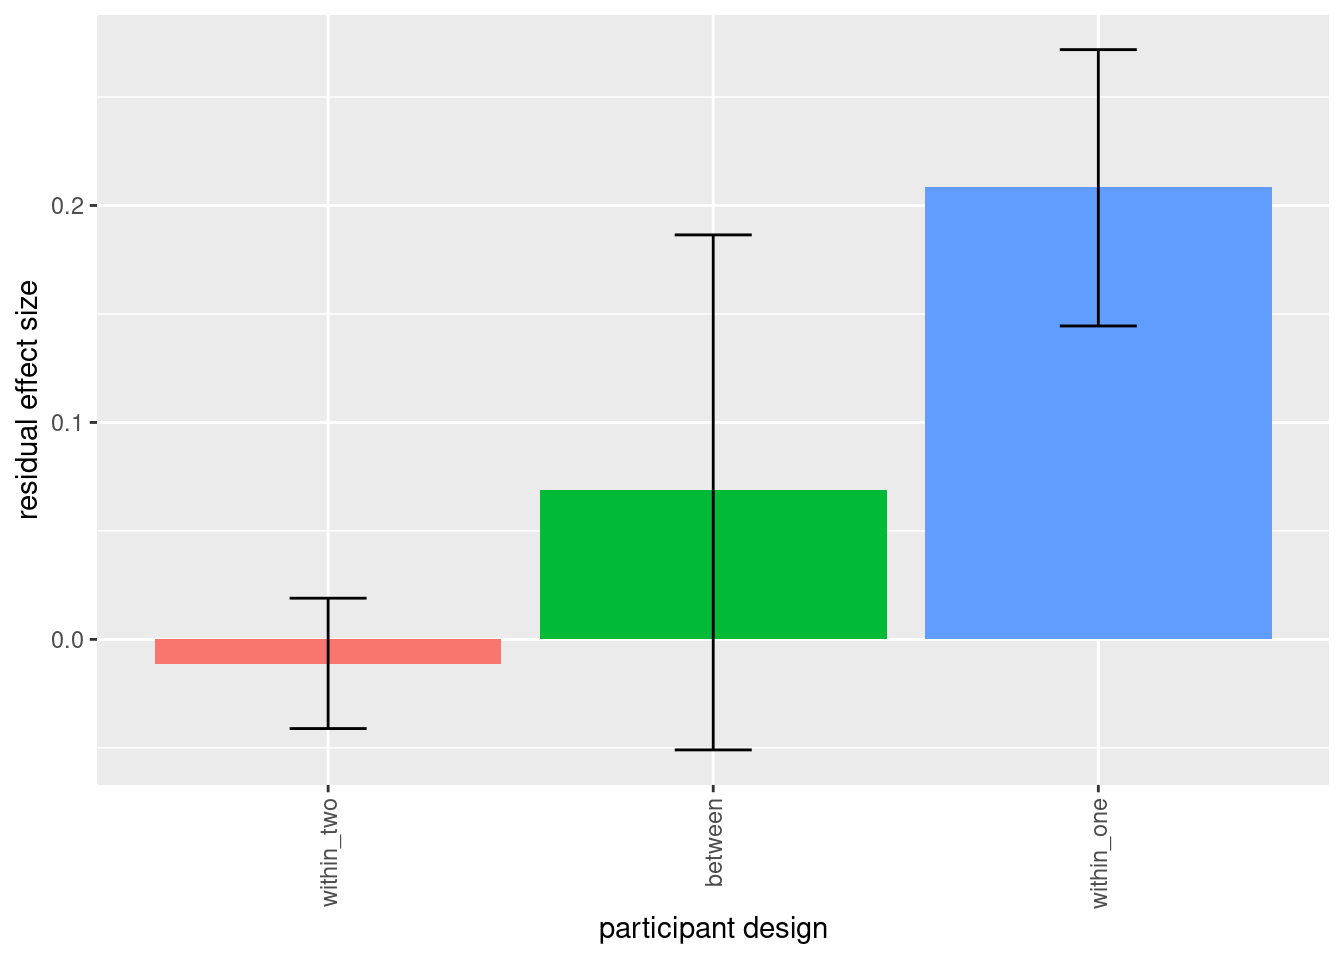
participant_design.pd.all = metalab_data %>%
  group_by(participant_design) %>%
  multi_boot_standard(col = "residual.d") %>%
  ungroup() %>%
  mutate(participant_design = reorder(participant_design, mean))

ggplot(participant_design.pd.all,
       aes(x = participant_design, y = mean, fill = participant_design)) +
  geom_bar(position="dodge", stat="identity") +
  geom_errorbar(aes(ymin = ci_lower, ymax = ci_upper),
                width=0.2, position="dodge") +
  ylab("residual effect size") +
  xlab("participant design") +
  theme(legend.position="none") +
  theme (axis.text.x = element_text(angle = 90, hjust = 1, vjust = .5))